
House Prices in DN5
House prices in DN5 have an overall average of £208,352 over the last year.
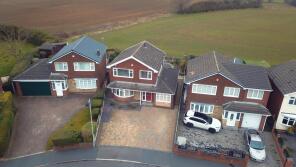
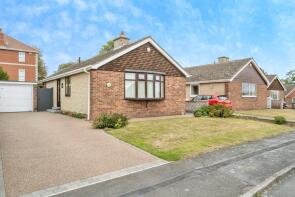
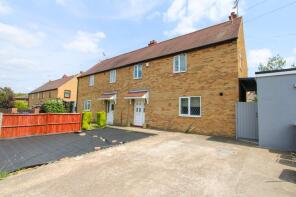
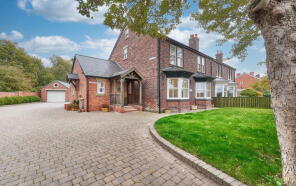
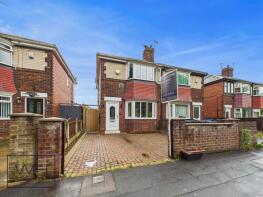
The majority of properties sold in DN5 during the last year were semi-detached properties, selling for an average price of £185,086. Detached properties sold for an average of £342,033, with terraced properties fetching £130,179.
Overall, the historical sold prices in DN5 over the last year were 2% down on the previous year and 9% up on the 2023 peak of £190,938.
Properties Sold
31, Clifton Drive, Sprotbrough, Doncaster DN5 7NL
| Today | See what it's worth now |
| 24 Apr 2026 | £340,000 |
| 28 Nov 2014 | £195,000 |
No other historical records.
53, Tennyson Avenue, Sprotbrough, Doncaster DN5 8EW
| Today | See what it's worth now |
| 24 Apr 2026 | £140,000 |
| 14 Dec 2018 | £110,000 |
23, Colchester Court, Cusworth, Doncaster DN5 8NT

| Today | See what it's worth now |
| 15 Apr 2026 | £170,000 |
No other historical records.
Extensions and planning permission in DN5
See planning approval stats, extension build costs and value added estimates.

195, Sprotbrough Road, Sprotbrough, Doncaster DN5 8BP
| Today | See what it's worth now |
| 15 Apr 2026 | £245,000 |
| 6 Jun 2013 | £150,000 |
No other historical records.
8, Ivanhoe Way, Sprotbrough, Doncaster DN5 8DZ

| Today | See what it's worth now |
| 10 Apr 2026 | £235,000 |
| 23 Oct 2008 | £121,000 |
5, Truman Street, Bentley, Doncaster DN5 0BZ

| Today | See what it's worth now |
| 10 Apr 2026 | £122,000 |
| 23 Nov 2016 | £80,000 |
No other historical records.
60, Rowena Drive, Scawsby, Doncaster DN5 8QU
| Today | See what it's worth now |
| 2 Apr 2026 | £150,000 |
| 24 Aug 2011 | £78,000 |
No other historical records.
139, The Avenue, Bentley, Doncaster DN5 0PS
| Today | See what it's worth now |
| 2 Apr 2026 | £120,000 |
| 11 Jul 2008 | £75,000 |
No other historical records.
4, Scotsman Drive, Scawthorpe, Doncaster DN5 9JB

| Today | See what it's worth now |
| 2 Apr 2026 | £197,000 |
| 4 Sep 2009 | £145,950 |
No other historical records.
16, Westongales Way, Bentley, Doncaster DN5 0UJ
| Today | See what it's worth now |
| 2 Apr 2026 | £267,500 |
| 27 Mar 2020 | £200,000 |
82, Lauder Road, Bentley, Doncaster DN5 9RP
| Today | See what it's worth now |
| 2 Apr 2026 | £126,600 |
No other historical records.
100, Sprotbrough Road, Sprotbrough, Doncaster DN5 8AZ
| Today | See what it's worth now |
| 1 Apr 2026 | £220,000 |
| 2 Sep 2004 | £130,000 |
No other historical records.
1, St Peters Close, Barnburgh, Doncaster DN5 7EN
| Today | See what it's worth now |
| 1 Apr 2026 | £285,000 |
No other historical records.
9, Melton Road, Sprotbrough, Doncaster DN5 7AH
| Today | See what it's worth now |
| 30 Mar 2026 | £178,000 |
| 1 Jun 2022 | £160,000 |
No other historical records.
1, Springfield Court, Cusworth, Doncaster DN5 8UP

| Today | See what it's worth now |
| 30 Mar 2026 | £147,500 |
| 13 Nov 2015 | £105,000 |
No other historical records.
25, Green Lane, Barnburgh, Doncaster DN5 7HR
| Today | See what it's worth now |
| 27 Mar 2026 | £160,000 |
| 8 Apr 2016 | £99,000 |
1, Green Lane, Barnburgh, Barnsley DN5 7HR
| Today | See what it's worth now |
| 27 Mar 2026 | £490,000 |
No other historical records.
10, Williams Road, Cusworth, Doncaster DN5 8HW
| Today | See what it's worth now |
| 26 Mar 2026 | £158,000 |
| 18 Aug 2022 | £153,000 |
116, Petersgate, Scawthorpe, Doncaster DN5 9JH
| Today | See what it's worth now |
| 23 Mar 2026 | £160,000 |
| 16 Dec 2022 | £158,000 |
20, Belvoir Avenue, Barnburgh, Doncaster DN5 7EX
| Today | See what it's worth now |
| 20 Mar 2026 | £205,000 |
| 17 Mar 2023 | £190,000 |
No other historical records.
4, Fox Gardens, Bentley, Doncaster DN5 0NF
| Today | See what it's worth now |
| 20 Mar 2026 | £225,000 |
| 26 Jul 2019 | £145,000 |
20, Riverhead, Sprotbrough, Doncaster DN5 7QR
| Today | See what it's worth now |
| 19 Mar 2026 | £220,000 |
| 25 Oct 2019 | £185,000 |
No other historical records.
The Manor House, Cusworth Lane, Cusworth, Doncaster DN5 7TR
| Today | See what it's worth now |
| 18 Mar 2026 | £630,000 |
No other historical records.
Source Acknowledgement: © Crown copyright. England and Wales house price data is publicly available information produced by the HM Land Registry.This material was last updated on 9 July 2026. It covers the period from 1 January 1995 to 30 April 2026 and contains property transactions which have been registered during that period. Contains HM Land Registry data © Crown copyright and database right 2026. This data is licensed under the Open Government Licence v3.0.
Disclaimer: Rightmove.co.uk provides this HM Land Registry data "as is". The burden for fitness of the data relies completely with the user and is provided for informational purposes only. No warranty, express or implied, is given relating to the accuracy of content of the HM Land Registry data and Rightmove does not accept any liability for error or omission. If you have found an error with the data or need further information please contact HM Land Registry.
Permitted Use: Viewers of this Information are granted permission to access this Crown copyright material and to download it onto electronic, magnetic, optical or similar storage media provided that such activities are for private research, study or in-house use only. Any other use of the material requires the formal written permission of Land Registry which can be requested from us, and is subject to an additional licence and associated charge.
Rightmove takes no liability for your use of, or reliance on, Rightmove's Instant Valuation due to the limitations of our tracking tool listed here. Use of this tool is taken entirely at your own risk. All rights reserved.