
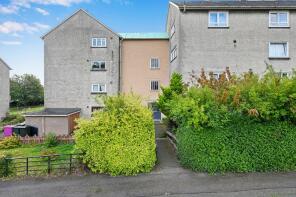
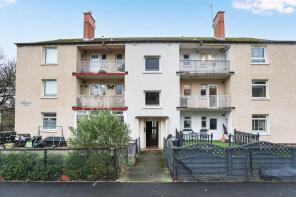
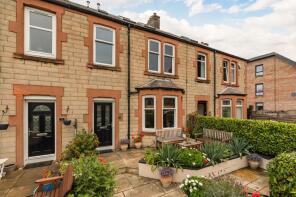
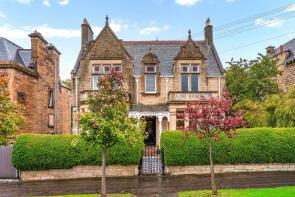
House Prices in Duddingston
House prices in Duddingston have an overall average of £372,338 over the last year.
The majority of properties sold in Duddingston during the last year were flats, selling for an average price of £201,343. Terraced properties sold for an average of £337,788, with detached properties fetching £634,339.
Overall, the historical sold prices in Duddingston over the last year were 12% up on the previous year and 7% up on the 2022 peak of £347,840.
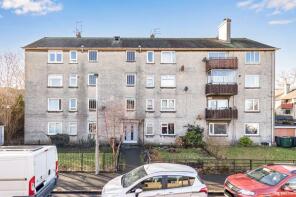
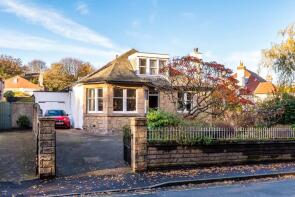
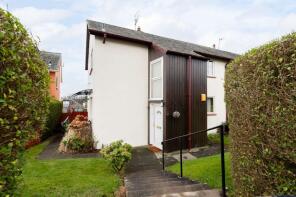
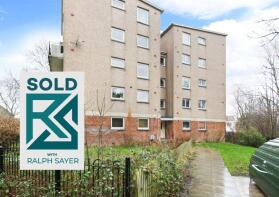
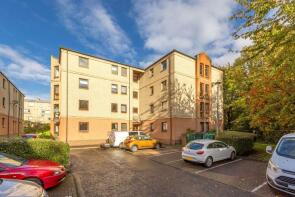
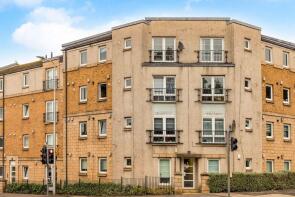
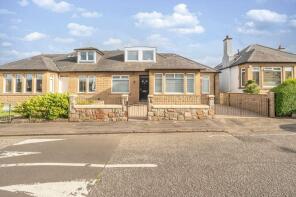
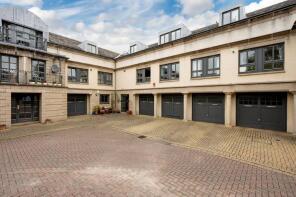
Properties Sold
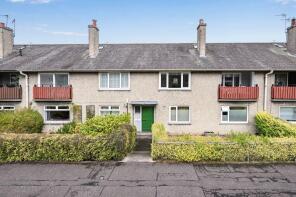
Flat 5, 2, Lady Nairne Crescent, Duddingston, Edinburgh EH8 7PF
| Today | See what it's worth now |
| 30 Apr 2026 | £168,000 |
No other historical records.
70, Duddingston Road West, Duddingston, Edinburgh EH15 3PT
| Today | See what it's worth now |
| 30 Apr 2026 | £662,250 |
No other historical records.
17b, Meadowfield Terrace, Duddingston, Edinburgh EH8 7NR

| Today | See what it's worth now |
| 24 Apr 2026 | £810,000 |
| 26 Apr 2022 | £750,000 |
No other historical records.
26, Lady Nairne Crescent, Duddingston, Edinburgh EH8 7PF

| Today | See what it's worth now |
| 17 Apr 2026 | £375,000 |
No other historical records.
43, Lady Nairne Crescent, Duddingston, Edinburgh EH8 7PD
| Today | See what it's worth now |
| 16 Apr 2026 | £405,000 |
No other historical records.
Flat 5, 44, Northfield Drive, Mountcastle, Edinburgh EH8 7RH
| Today | See what it's worth now |
| 13 Apr 2026 | £183,150 |
| 1 Sep 2005 | £80,000 |
No other historical records.
Flat 7, 11, Lady Nairne Loan, Duddingston, Edinburgh EH8 7NL
| Today | See what it's worth now |
| 13 Apr 2026 | £167,000 |
No other historical records.
1d, Niddrie Mill Place, Niddrie, Edinburgh EH15 3HE
| Today | See what it's worth now |
| 9 Apr 2026 | £130,136 |
No other historical records.
24, Durham Road, Durham, Edinburgh EH15 1NY
| Today | See what it's worth now |
| 30 Mar 2026 | £672,000 |
| 7 Sep 2012 | £291,945 |
No other historical records.
75, Durham Road, Edinburgh EH15 1PE
| Today | See what it's worth now |
| 30 Mar 2026 | £590,000 |
No other historical records.
3, Durham Road, Durham, Edinburgh EH15 1NU
| Today | See what it's worth now |
| 23 Mar 2026 | £1,200,000 |
| 3 May 2019 | £945,000 |
No other historical records.
Flat 14, 12, Duddingston Mills, Mountcastle, Edinburgh EH8 7TU
| Today | See what it's worth now |
| 20 Mar 2026 | £208,500 |
| 23 Jun 2015 | £130,028 |
Flat 7, 215, Duddingston Park South, Bingham, Edinburgh EH15 3EJ
| Today | See what it's worth now |
| 6 Mar 2026 | £175,000 |
| 4 Feb 2004 | £123,000 |
No other historical records.
7, Hamilton Gardens, Edinburgh EH15 1NH
| Today | See what it's worth now |
| 17 Feb 2026 | £525,000 |
No other historical records.
84, Milton Road West, Edinburgh EH15 1RD
| Today | See what it's worth now |
| 13 Feb 2026 | £450,000 |
No other historical records.
121, Mountcastle Drive South, Bingham, Edinburgh EH15 3LR

| Today | See what it's worth now |
| 4 Feb 2026 | £295,000 |
| 17 Dec 2024 | £300,000 |
Flat 1, 34, Cavalry Park Drive, Duddingston, Edinburgh EH15 3QG
| Today | See what it's worth now |
| 27 Jan 2026 | £345,508 |
| 21 Sep 2006 | £235,000 |
No other historical records.
Flat 4, 3, Lady Nairne Crescent, Duddingston, Edinburgh EH8 7PE
| Today | See what it's worth now |
| 23 Jan 2026 | £184,500 |
| 6 Nov 2023 | £140,110 |
No other historical records.
76, Duddingston Road West, Duddingston, Edinburgh EH15 3PT
| Today | See what it's worth now |
| 22 Jan 2026 | £610,000 |
No other historical records.
52, Durham Terrace, Edinburgh EH15 1QE
| Today | See what it's worth now |
| 21 Jan 2026 | £450,000 |
No other historical records.
23, Durham Drive, Durham, Edinburgh EH15 1PH

| Today | See what it's worth now |
| 19 Jan 2026 | £627,000 |
| 27 Feb 2017 | £384,500 |
No other historical records.
Flat 1, 74, Duddingston Row, Bingham, Edinburgh EH15 3NJ
| Today | See what it's worth now |
| 12 Jan 2026 | £125,878 |
| 31 Jan 2002 | £11,520 |
No other historical records.
19, Southfield Terrace, Edinburgh EH15 1RE
| Today | See what it's worth now |
| 12 Jan 2026 | £370,000 |
No other historical records.

Source Acknowledgement: © Crown copyright. Scottish house price data is publicly available information produced by the Registers of Scotland. Material has been reproduced with the permission of the Keeper of the Registers of Scotland and contains data compiled by Registers of Scotland. For further information, please contact data@ros.gov.uk. Please note the dates shown here relate to the property's registered date not sold date.This material was last updated on 10 July 2026. It covers the period from 8 December 1987 to 30 April 2026 and contains property transactions which have been registered during that period.
Disclaimer: Rightmove.co.uk provides this Registers of Scotland data "as is". The burden for fitness of the data relies completely with the user and is provided for informational purposes only. No warranty, express or implied, is given relating to the accuracy of content of the Registers of Scotland data and Rightmove plc does not accept any liability for error or omission. If you have found an error with the data or need further information please contact data@ros.gov.uk
Permitted Use: The Registers of Scotland allows the reproduction of the data which it provides to Rightmove.co.uk free of charge in any format or medium only for research, private study or for internal circulation within an organisation. This is subject to it being reproduced accurately and not used in a misleading context. The material must be acknowledged as Crown Copyright. You are not allowed to use this information for commercial purposes, nor must you copy, distribute, sell or publish the data in any way. For any other use of this material, please apply to the Registers of Scotland for a licence. You can do this online at www.ros.gov.uk, by email at data@ros.gov.uk or by writing to Business Development, Registers of Scotland, Meadowbank House, 153 London Road, Edinburgh EH8 7AU.
Rightmove takes no liability for your use of, or reliance on, Rightmove's Instant Valuation due to the limitations of our tracking tool listed here. Use of this tool is taken entirely at your own risk. All rights reserved.