
House Prices in Durlock
House prices in Durlock have an overall average of £306,231 over the last year.
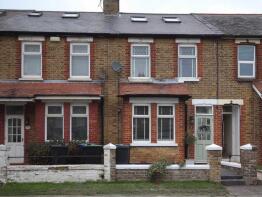
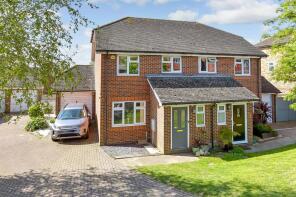
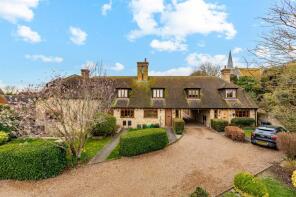
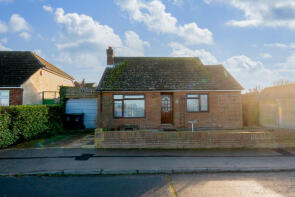
The majority of properties sold in Durlock during the last year were semi-detached properties, selling for an average price of £331,467. Terraced properties sold for an average of £253,313, with detached properties fetching £352,557.
Overall, the historical sold prices in Durlock over the last year were 9% down on the previous year and 22% down on the 2022 peak of £391,088.
Properties Sold
118, Monkton Road, Minster CT12 4EF
| Today | See what it's worth now |
| 5 Dec 2025 | £240,000 |
No other historical records.
38, Tothill Street, Ramsgate CT12 4AJ
| Today | See what it's worth now |
| 31 Oct 2025 | £320,000 |
| 7 Sep 2007 | £169,000 |
No other historical records.
33, Burgess Close, Minster, Ramsgate CT12 4BD
| Today | See what it's worth now |
| 29 Oct 2025 | £138,000 |
| 8 Feb 2005 | £111,000 |
8, Freemans Road, Ramsgate CT12 4DJ
| Today | See what it's worth now |
| 29 Oct 2025 | £325,000 |
| 12 Oct 2012 | £141,000 |
No other historical records.
Tan Et Lodge, Mount Pleasant, Ramsgate CT12 4AU
| Today | See what it's worth now |
| 17 Oct 2025 | £455,000 |
| 29 May 2015 | £340,000 |
No other historical records.
24, Orchard Close, Ramsgate CT12 4AL

| Today | See what it's worth now |
| 14 Oct 2025 | £395,000 |
| 9 Jun 2017 | £327,500 |
53, Monkton Road, Ramsgate CT12 4ED
| Today | See what it's worth now |
| 22 Sep 2025 | £400,000 |
| 1 Jun 2007 | £235,000 |
45, Tothill Street, Ramsgate CT12 4AJ
| Today | See what it's worth now |
| 11 Sep 2025 | £410,000 |
| 6 May 2003 | £182,000 |
49, Rose Gardens, Minster, Ramsgate CT12 4AQ

| Today | See what it's worth now |
| 10 Sep 2025 | £375,000 |
| 22 Mar 2022 | £220,000 |
36, Rose Gardens, Minster, Ramsgate CT12 4AQ
| Today | See what it's worth now |
| 10 Sep 2025 | £190,000 |
| 14 Jun 2021 | £190,000 |
No other historical records.
1, Augustine Road, Ramsgate CT12 4DG
| Today | See what it's worth now |
| 9 Sep 2025 | £387,500 |
| 28 Oct 2016 | £280,000 |
184, Monkton Street, Ramsgate CT12 4JN
| Today | See what it's worth now |
| 4 Sep 2025 | £355,000 |
| 20 Dec 2013 | £170,000 |
22, Prospect Road, Ramsgate CT12 4EG
| Today | See what it's worth now |
| 29 Aug 2025 | £141,001 |
| 31 May 2024 | £300,000 |
9, Prospect Gardens, Ramsgate CT12 4EH


| Today | See what it's worth now |
| 29 Aug 2025 | £300,000 |
| 5 Feb 2021 | £295,000 |
3, St Crispins Close, Ramsgate CT12 4FB
| Today | See what it's worth now |
| 27 Aug 2025 | £327,500 |
| 6 Nov 2020 | £435,000 |
No other historical records.
3, Fairfield Road, Minster, Ramsgate CT12 4AW
| Today | See what it's worth now |
| 22 Aug 2025 | £314,500 |
| 1 Mar 2017 | £219,995 |
18, Hill House Drive, Minster, Ramsgate CT12 4BE
| Today | See what it's worth now |
| 22 Aug 2025 | £315,000 |
| 17 Jan 2020 | £290,000 |
3, Sackett Court, Conyngham Road, Ramsgate CT12 4HA
| Today | See what it's worth now |
| 19 Aug 2025 | £305,000 |
| 12 Aug 2016 | £280,000 |
18, Augustine Road, Ramsgate CT12 4DQ

| Today | See what it's worth now |
| 18 Aug 2025 | £250,000 |
| 15 May 2007 | £175,000 |
No other historical records.
11, Greenhill Gardens, Minster, Ramsgate CT12 4EP
| Today | See what it's worth now |
| 11 Aug 2025 | £305,400 |
No other historical records.
25, Watchester Lane, Minster, Ramsgate CT12 4DA
| Today | See what it's worth now |
| 4 Aug 2025 | £290,000 |
| 29 Jan 2021 | £268,000 |
50, Durlock, Minster CT12 4HE
| Today | See what it's worth now |
| 28 Jul 2025 | £310,000 |
No other historical records.
55, Augustine Road, Minster, Ramsgate CT12 4DQ
| Today | See what it's worth now |
| 17 Jul 2025 | £220,000 |
No other historical records.
32, Molineux Road, Ramsgate CT12 4DS
| Today | See what it's worth now |
| 2 Jul 2025 | £195,000 |
| 4 Mar 2022 | £186,000 |
No other historical records.
15, St Mildreds Road, Ramsgate CT12 4DE
| Today | See what it's worth now |
| 1 Jul 2025 | £350,000 |
| 1 Dec 2011 | £205,000 |
Source Acknowledgement: © Crown copyright. England and Wales house price data is publicly available information produced by the HM Land Registry.This material was last updated on 4 February 2026. It covers the period from 1 January 1995 to 24 December 2025 and contains property transactions which have been registered during that period. Contains HM Land Registry data © Crown copyright and database right 2026. This data is licensed under the Open Government Licence v3.0.
Disclaimer: Rightmove.co.uk provides this HM Land Registry data "as is". The burden for fitness of the data relies completely with the user and is provided for informational purposes only. No warranty, express or implied, is given relating to the accuracy of content of the HM Land Registry data and Rightmove does not accept any liability for error or omission. If you have found an error with the data or need further information please contact HM Land Registry.
Permitted Use: Viewers of this Information are granted permission to access this Crown copyright material and to download it onto electronic, magnetic, optical or similar storage media provided that such activities are for private research, study or in-house use only. Any other use of the material requires the formal written permission of Land Registry which can be requested from us, and is subject to an additional licence and associated charge.
Map data ©OpenStreetMap contributors.
Rightmove takes no liability for your use of, or reliance on, Rightmove's Instant Valuation due to the limitations of our tracking tool listed here. Use of this tool is taken entirely at your own risk. All rights reserved.