
House Prices in Durrants
House prices in Durrants have an overall average of £515,944 over the last year.
The majority of properties sold in Durrants during the last year were detached properties, selling for an average price of £671,933. Semi-detached properties sold for an average of £506,300, with terraced properties fetching £361,500.
Overall, the historical sold prices in Durrants over the last year were 20% down on the previous year and 13% down on the 2022 peak of £594,139.
Properties Sold
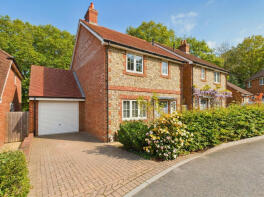
37, Bailey Road, Rowland's Castle PO9 6BF
| Today | See today's value |
| 31 Jul 2026 | £500,000 |
| 10 Dec 2018 | £399,950 |
No other historical records.
82, Redhill Road, Rowland's Castle PO9 6DF
| Today | See today's value |
| 30 Jul 2026 | £350,000 |
| 24 Aug 2021 | £346,000 |
No other historical records.
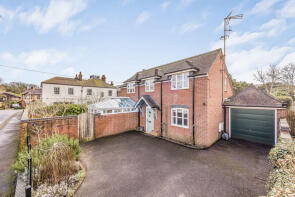
1a, Castle Road, Rowland's Castle PO9 6AP
| Today | See today's value |
| 30 Jul 2026 | £555,000 |
| 29 Oct 2021 | £475,000 |
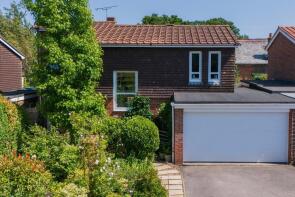
5, Hill Brow Close, Rowland's Castle PO9 6DJ
| Today | See today's value |
| 30 Jul 2026 | £585,000 |
| 8 Jan 2010 | £357,500 |
70, The Green, Rowland's Castle PO9 6AB

| Today | See today's value |
| 27 Jul 2026 | £252,000 |
| 22 Jan 2015 | £298,000 |
No other historical records.
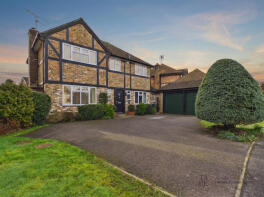
11, Brambling Road, Rowland's Castle PO9 6HF
| Today | See today's value |
| 23 Jul 2026 | £680,000 |
| 5 Feb 2021 | £530,000 |
49, Mallard Road, Rowland's Castle PO9 6HN
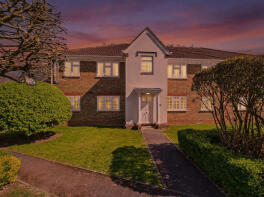
| Today | See today's value |
| 17 Jul 2026 | £150,000 |
| 20 Jun 1997 | £40,000 |
No other historical records.
39, Mallard Road, Rowland's Castle PO9 6HN
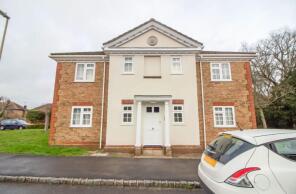
| Today | See today's value |
| 3 Jul 2026 | £140,000 |
| 27 Feb 2004 | £90,000 |
59 Downlea, Finchdean Road, Rowland's Castle PO9 6DA
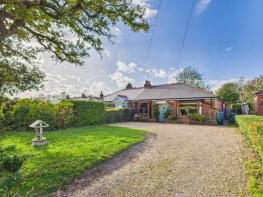
| Today | See today's value |
| 30 Jun 2026 | £660,000 |
| 17 Oct 2008 | £370,000 |
21, Nuthatch Close, Rowland's Castle PO9 6HW
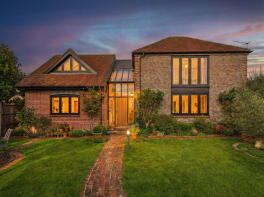
| Today | See today's value |
| 30 Jun 2026 | £660,000 |
| 30 Jun 2021 | £615,000 |
1, 78 Bowes Hill Court, Bowes Hill, Rowland's Castle PO9 6BS
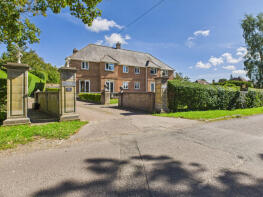
| Today | See today's value |
| 3 Jun 2026 | £240,000 |
| 11 Nov 2020 | £240,000 |
74, Redhill Road, Rowland's Castle PO9 6DF

| Today | See today's value |
| 5 May 2026 | £452,000 |
| 27 Sep 2013 | £302,000 |
9, Redhill Road, Rowland's Castle PO9 6AL

| Today | See today's value |
| 1 May 2026 | £540,000 |
| 24 Oct 2005 | £295,000 |
No other historical records.
12, Nuthatch Close, Rowland's Castle PO9 6HW
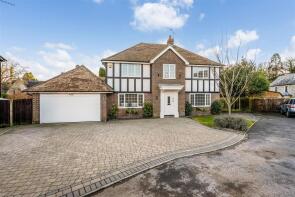
| Today | See today's value |
| 1 May 2026 | £705,000 |
| 10 Feb 2017 | £537,500 |
No other historical records.
8, Durrants Gardens, Rowland's Castle PO9 6BJ

| Today | See today's value |
| 1 May 2026 | £450,000 |
| 31 Jan 2014 | £212,000 |
No other historical records.
40, Dunnock Close, Rowland's Castle PO9 6HQ
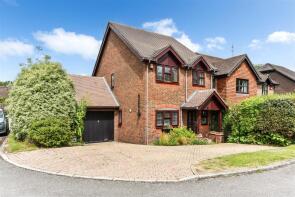
| Today | See today's value |
| 24 Apr 2026 | £455,000 |
| 27 Oct 2023 | £465,000 |
7, Durrants Road, Rowland's Castle PO9 6BE

| Today | See today's value |
| 10 Apr 2026 | £370,000 |
| 3 Aug 2018 | £292,000 |
1, Nightingale Close, Rowland's Castle PO9 6EU

| Today | See today's value |
| 20 Mar 2026 | £280,000 |
| 18 Mar 2021 | £249,995 |
46, Deerleap Lane, Rowland's Castle PO9 6FD

| Today | See today's value |
| 6 Mar 2026 | £369,000 |
| 17 Feb 2021 | £335,000 |
No other historical records.
1, Castle Road, Rowlands Castle PO9 6AP
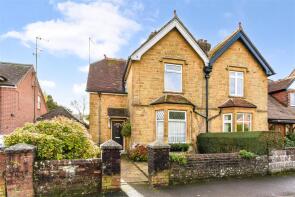
| Today | See today's value |
| 5 Mar 2026 | £450,000 |
No other historical records.
65, Castle Road, Rowland's Castle PO9 6AR

| Today | See today's value |
| 27 Feb 2026 | £450,000 |
| 9 Jun 2023 | £445,000 |
11, Deerleap Lane, Rowland's Castle PO9 6FD

| Today | See today's value |
| 9 Jan 2026 | £545,000 |
| 9 Sep 2020 | £425,000 |
No other historical records.
21, The Peak, Rowlands Castle PO9 6AH

| Today | See today's value |
| 9 Jan 2026 | £925,000 |
No other historical records.

Rightmove takes no liability for your use of, or reliance on, Rightmove's Instant Valuation due to the limitations of our tracking tool listed here. Use of this tool is taken entirely at your own risk. All rights reserved.