
House Prices in DY8
House prices in DY8 have an overall average of £289,449 over the last year.
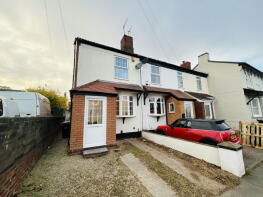
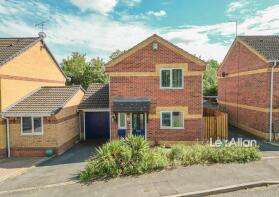
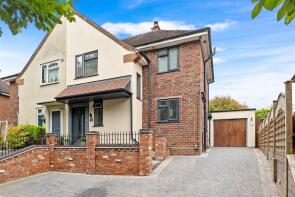
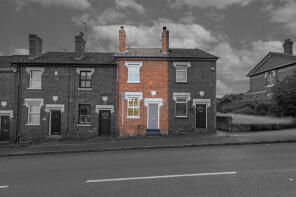
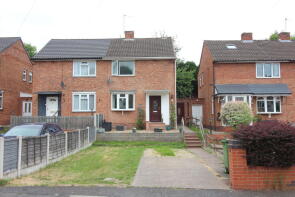
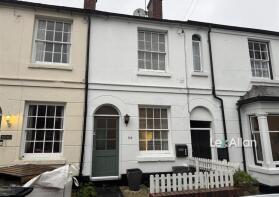
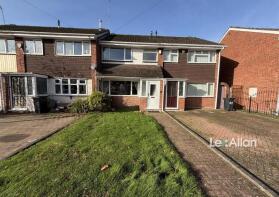
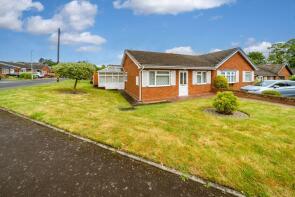
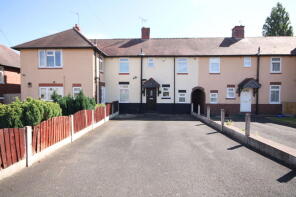
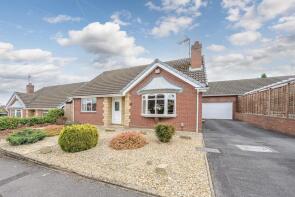
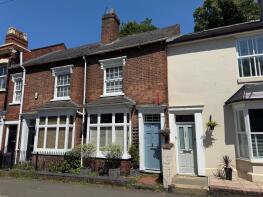
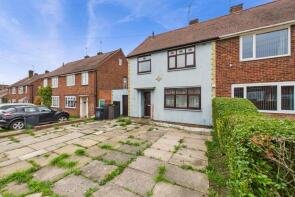
The majority of properties sold in DY8 during the last year were semi-detached properties, selling for an average price of £275,301. Detached properties sold for an average of £441,268, with terraced properties fetching £245,920.
Overall, the historical sold prices in DY8 over the last year were 2% up on the previous year and 5% up on the 2023 peak of £275,152.
Properties Sold
45, Kinver Street, Stourbridge DY8 5AB
| Today | See what it's worth now |
| 24 Apr 2026 | £268,000 |
| 31 Aug 2022 | £235,000 |
1, Keats Close, Stourbridge DY8 4NA
| Today | See what it's worth now |
| 21 Apr 2026 | £325,000 |
| 13 Sep 1996 | £68,500 |
No other historical records.
29, Wentworth Road, Stourbridge DY8 4SB
| Today | See what it's worth now |
| 20 Apr 2026 | £275,000 |
| 31 Jan 2023 | £240,000 |
Extensions and planning permission in DY8
See planning approval stats, extension build costs and value added estimates.

26, Braemar Avenue, Stourbridge DY8 5HU
| Today | See what it's worth now |
| 17 Apr 2026 | £290,000 |
| 29 Jan 2010 | £150,000 |
3, Wood Street, Stourbridge DY8 4NN
| Today | See what it's worth now |
| 15 Apr 2026 | £213,500 |
| 12 Aug 2002 | £87,950 |
No other historical records.
19, Richardson Drive, Stourbridge DY8 4DN
| Today | See what it's worth now |
| 8 Apr 2026 | £300,000 |
| 30 Nov 2015 | £199,950 |
134, Birmingham Street, Stourbridge DY8 1JL
| Today | See what it's worth now |
| 7 Apr 2026 | £280,000 |
| 25 Nov 2022 | £255,000 |
No other historical records.
245, Bridgnorth Road, Stourbridge DY8 3PW
| Today | See what it's worth now |
| 7 Apr 2026 | £217,500 |
| 21 Mar 2014 | £144,500 |
41, Smalman Close, Stourbridge DY8 5TF

| Today | See what it's worth now |
| 2 Apr 2026 | £146,000 |
| 5 Jun 2018 | £107,000 |
24, Foxhills Road, Stourbridge DY8 5AL
| Today | See what it's worth now |
| 2 Apr 2026 | £185,000 |
| 16 Mar 2018 | £114,000 |
No other historical records.
59, Corser Street, Stourbridge DY8 2DQ
| Today | See what it's worth now |
| 2 Apr 2026 | £238,000 |
| 1 Dec 2010 | £131,500 |
39, Arlington Court, Stourbridge DY8 1NN
| Today | See what it's worth now |
| 2 Apr 2026 | £246,500 |
| 4 May 2016 | £135,000 |
5, Quorn Crescent, Stourbridge DY8 5NW
| Today | See what it's worth now |
| 2 Apr 2026 | £280,000 |
| 30 Apr 2015 | £168,000 |
55, John Street, Stourbridge DY8 5YS

| Today | See what it's worth now |
| 31 Mar 2026 | £255,500 |
| 11 May 2007 | £124,000 |
15, Liddiard Court, Belfry Drive, Stourbridge DY8 3SD

| Today | See what it's worth now |
| 31 Mar 2026 | £85,000 |
| 6 Oct 2017 | £94,000 |
11, Whitmore Road, Stourbridge DY8 3RE
| Today | See what it's worth now |
| 31 Mar 2026 | £220,000 |
| 3 Mar 2021 | £175,550 |
8, Twickenham Court, Stourbridge DY8 4QG
| Today | See what it's worth now |
| 31 Mar 2026 | £495,000 |
| 25 Apr 2017 | £320,000 |
No other historical records.
49, Hagley Road, Stourbridge DY8 1QR
| Today | See what it's worth now |
| 31 Mar 2026 | £202,000 |
| 22 Sep 1995 | £44,000 |
No other historical records.
13, Sandfield Road, Stourbridge DY8 5UQ
| Today | See what it's worth now |
| 30 Mar 2026 | £157,500 |
| 18 Mar 2008 | £130,000 |
21 Victoria House, Cecil Street, Stourbridge DY8 1XQ
| Today | See what it's worth now |
| 30 Mar 2026 | £220,000 |
| 17 May 2022 | £199,950 |
64, Birmingham Street, Stourbridge DY8 1JH
| Today | See what it's worth now |
| 27 Mar 2026 | £260,000 |
| 15 Jun 2017 | £170,000 |
Flat 19, 28 Constable House, New Road, Stourbridge DY8 1RP
| Today | See what it's worth now |
| 27 Mar 2026 | £160,000 |
| 16 Apr 2021 | £137,000 |
No other historical records.
14, Dennis Hall Road, Stourbridge DY8 4EL
| Today | See what it's worth now |
| 27 Mar 2026 | £255,000 |
| 6 Nov 2020 | £200,000 |
Source Acknowledgement: © Crown copyright. England and Wales house price data is publicly available information produced by the HM Land Registry.This material was last updated on 9 July 2026. It covers the period from 1 January 1995 to 30 April 2026 and contains property transactions which have been registered during that period. Contains HM Land Registry data © Crown copyright and database right 2026. This data is licensed under the Open Government Licence v3.0.
Disclaimer: Rightmove.co.uk provides this HM Land Registry data "as is". The burden for fitness of the data relies completely with the user and is provided for informational purposes only. No warranty, express or implied, is given relating to the accuracy of content of the HM Land Registry data and Rightmove does not accept any liability for error or omission. If you have found an error with the data or need further information please contact HM Land Registry.
Permitted Use: Viewers of this Information are granted permission to access this Crown copyright material and to download it onto electronic, magnetic, optical or similar storage media provided that such activities are for private research, study or in-house use only. Any other use of the material requires the formal written permission of Land Registry which can be requested from us, and is subject to an additional licence and associated charge.
Rightmove takes no liability for your use of, or reliance on, Rightmove's Instant Valuation due to the limitations of our tracking tool listed here. Use of this tool is taken entirely at your own risk. All rights reserved.