
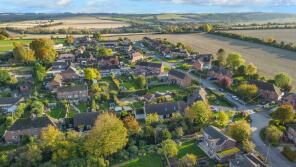
House Prices in East Challow
House prices in East Challow have an overall average of £463,821 over the last year.
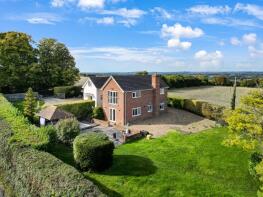
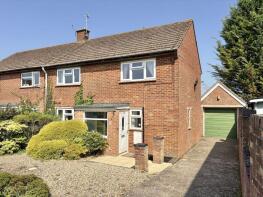
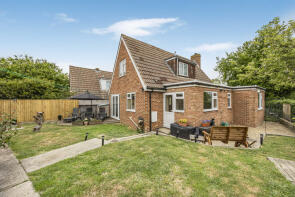
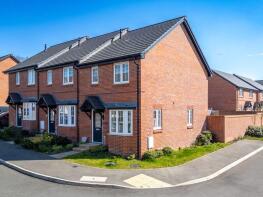
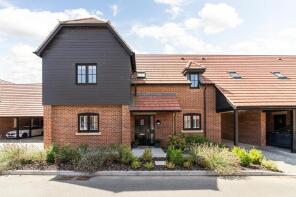
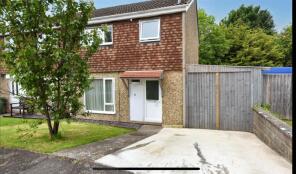
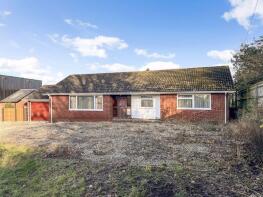
The majority of properties sold in East Challow during the last year were semi-detached properties, selling for an average price of £317,000. Detached properties sold for an average of £659,583.
Overall, the historical sold prices in East Challow over the last year were 11% up on the previous year and 4% down on the 2022 peak of £485,119.
Properties Sold
Windmill House, Ickleton Road, East Challow, Wantage OX12 9JB
| Today | See what it's worth now |
| 17 Mar 2026 | £908,750 |
| 7 Feb 1997 | £111,000 |
No other historical records.
1, Hazel Close, East Challow, Wantage OX12 9FY
| Today | See what it's worth now |
| 6 Mar 2026 | £325,000 |
| 12 Mar 2021 | £305,000 |
No other historical records.
14, Hill Close, East Challow, Wantage OX12 9RU
| Today | See what it's worth now |
| 10 Feb 2026 | £268,500 |
No other historical records.
28, Hamilton Drive, East Challow, Wantage OX12 9JX
| Today | See what it's worth now |
| 30 Jan 2026 | £735,000 |
| 12 Nov 2021 | £694,995 |
No other historical records.
Hide-a-way House, Hedge Hill Road, East Challow, Wantage OX12 9SF
| Today | See what it's worth now |
| 14 Nov 2025 | £335,000 |
| 27 May 2015 | £275,000 |
10, Glebe Road, East Challow, Wantage OX12 9FX
| Today | See what it's worth now |
| 17 Oct 2025 | £332,500 |
| 29 Apr 2022 | £325,000 |
No other historical records.
1, Willow Cottages, Letcombe Hill, East Challow, Wantage OX12 9RW
| Today | See what it's worth now |
| 1 Sep 2025 | £342,000 |
| 18 Dec 2018 | £287,500 |
5, Field Gardens, East Challow, Wantage OX12 9SE
| Today | See what it's worth now |
| 12 Jun 2025 | £295,000 |
No other historical records.
6, Old School Lane, East Challow, Wantage OX12 9SG
| Today | See what it's worth now |
| 22 May 2025 | £365,000 |
| 8 Sep 2017 | £245,000 |
No other historical records.
11, Meadow Court, East Challow, Wantage OX12 9WQ
| Today | See what it's worth now |
| 21 May 2025 | £550,000 |
| 30 May 2022 | £485,000 |
No other historical records.
7, Goodlake Avenue, East Challow, Wantage OX12 9BF
| Today | See what it's worth now |
| 7 May 2025 | £397,500 |
| 18 Jun 2021 | £400,000 |
No other historical records.
18, Field Gardens, East Challow, Wantage OX12 9SE
| Today | See what it's worth now |
| 2 May 2025 | £365,000 |
| 18 Aug 2014 | £240,000 |
3, Meadow Court, East Challow, Wantage OX12 9WQ
| Today | See what it's worth now |
| 31 Mar 2025 | £510,000 |
| 31 Mar 2022 | £504,495 |
No other historical records.
11, Canal Way, East Challow, Wantage OX12 9SU
| Today | See what it's worth now |
| 28 Mar 2025 | £315,000 |
| 14 Jan 2005 | £140,000 |
No other historical records.
The Bungalow, Letcombe Hill, East Challow, Wantage OX12 9RP
| Today | See what it's worth now |
| 26 Mar 2025 | £395,000 |
No other historical records.
Cote D Or, Sarajac Avenue, East Challow, Wantage OX12 9SA
| Today | See what it's worth now |
| 27 Feb 2025 | £302,500 |
No other historical records.
5, Childrey Way, East Challow, Wantage OX12 9RX
| Today | See what it's worth now |
| 5 Feb 2025 | £285,000 |
No other historical records.
24, Claypit Lane, East Challow, Wantage OX12 9WF
| Today | See what it's worth now |
| 4 Feb 2025 | £318,000 |
| 22 Feb 2018 | £300,000 |
16, Goodlake Avenue, East Challow, Wantage OX12 9BF
| Today | See what it's worth now |
| 17 Dec 2024 | £325,000 |
| 23 Jul 2021 | £299,000 |
No other historical records.
1, Field Gardens, East Challow, Wantage OX12 9SE
| Today | See what it's worth now |
| 15 Nov 2024 | £375,000 |
| 2 Dec 2020 | £340,000 |
11, Glebe Road, East Challow, Wantage OX12 9FX
| Today | See what it's worth now |
| 31 Oct 2024 | £585,000 |
No other historical records.
3, Goodlake Avenue, East Challow, Wantage OX12 9BF
| Today | See what it's worth now |
| 29 Oct 2024 | £255,000 |
No other historical records.
7, Hamilton Drive, East Challow, Wantage OX12 9JX

| Today | See what it's worth now |
| 27 Sep 2024 | £311,000 |
| 10 Nov 2020 | £289,995 |
No other historical records.
Source Acknowledgement: © Crown copyright. England and Wales house price data is publicly available information produced by the HM Land Registry.This material was last updated on 9 July 2026. It covers the period from 1 January 1995 to 30 April 2026 and contains property transactions which have been registered during that period. Contains HM Land Registry data © Crown copyright and database right 2026. This data is licensed under the Open Government Licence v3.0.
Disclaimer: Rightmove.co.uk provides this HM Land Registry data "as is". The burden for fitness of the data relies completely with the user and is provided for informational purposes only. No warranty, express or implied, is given relating to the accuracy of content of the HM Land Registry data and Rightmove does not accept any liability for error or omission. If you have found an error with the data or need further information please contact HM Land Registry.
Permitted Use: Viewers of this Information are granted permission to access this Crown copyright material and to download it onto electronic, magnetic, optical or similar storage media provided that such activities are for private research, study or in-house use only. Any other use of the material requires the formal written permission of Land Registry which can be requested from us, and is subject to an additional licence and associated charge.
Rightmove takes no liability for your use of, or reliance on, Rightmove's Instant Valuation due to the limitations of our tracking tool listed here. Use of this tool is taken entirely at your own risk. All rights reserved.