
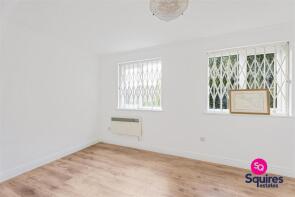
House Prices in East Finchley
House prices in East Finchley have an overall average of £954,940 over the last year.
The majority of properties sold in East Finchley during the last year were flats, selling for an average price of £487,953. Terraced properties sold for an average of £1,017,520, with semi-detached properties fetching £1,579,385.
Overall, the historical sold prices in East Finchley over the last year were 16% down on the previous year and 21% down on the 2022 peak of £1,205,476.
Properties Sold
Flat 5, Mansfield Heights, Great North Road, Hornsey, London N2 0NY
| Today | See what it's worth now |
| 15 Apr 2026 | £389,950 |
| 25 Mar 2011 | £237,000 |
113a, East End Road, Finchley, London N2 0SU

| Today | See what it's worth now |
| 7 Apr 2026 | £480,000 |
| 2 Oct 2015 | £415,000 |
36, Neale Close, East Finchley, London N2 0LF
| Today | See what it's worth now |
| 31 Mar 2026 | £575,000 |
| 21 Sep 2018 | £567,000 |
17, Simms Gardens, East Finchley, London N2 8HT
| Today | See what it's worth now |
| 27 Mar 2026 | £295,000 |
| 3 Nov 2000 | £138,000 |
No other historical records.
Flat 1, 119, East End Road, Finchley, London N2 0SZ
| Today | See what it's worth now |
| 27 Mar 2026 | £300,000 |
| 6 Sep 2006 | £208,000 |
26, Brendon Grove, East Finchley, London N2 8JZ

| Today | See what it's worth now |
| 25 Mar 2026 | £685,000 |
| 28 Apr 2011 | £355,000 |
1, Blaenavon, Fortis Green, Hornsey, London N2 9HT
| Today | See what it's worth now |
| 18 Mar 2026 | £590,000 |
| 14 Dec 2018 | £630,000 |
67, Brackenbury Road, East Finchley, London N2 0SS

| Today | See what it's worth now |
| 18 Mar 2026 | £815,500 |
| 4 Mar 2024 | £817,500 |
Flat 24, Mulberry Court, Bedford Road, East Finchley, London N2 9DZ
| Today | See what it's worth now |
| 12 Mar 2026 | £140,000 |
| 25 Jul 2007 | £245,950 |
No other historical records.
11, Deanery Close, East Finchley, London N2 8NS

| Today | See what it's worth now |
| 6 Mar 2026 | £375,000 |
No other historical records.
13, Aylmer Road, Hornsey, London N2 0BS
| Today | See what it's worth now |
| 4 Mar 2026 | £2,050,000 |
No other historical records.
Flat 1, 352, High Road, East Finchley, London N2 9AB
| Today | See what it's worth now |
| 27 Feb 2026 | £291,000 |
No other historical records.
23, Greenfield Drive, Hornsey, London N2 9AF
| Today | See what it's worth now |
| 27 Feb 2026 | £783,000 |
| 23 Feb 2001 | £233,000 |
7, Vivian Way, East Finchley, London N2 0AB
| Today | See what it's worth now |
| 25 Feb 2026 | £2,100,000 |
| 7 May 1999 | £460,000 |
No other historical records.
Flat 38, Stokes Court, Diploma Avenue, East Finchley, London N2 8NX
| Today | See what it's worth now |
| 13 Feb 2026 | £255,000 |
| 3 Jun 2015 | £255,000 |
100, Hertford Road, East Finchley, London N2 9BU

| Today | See what it's worth now |
| 12 Feb 2026 | £1,530,000 |
No other historical records.
Flat 25, Mulberry Court, Bedford Road, East Finchley, London N2 9DZ
| Today | See what it's worth now |
| 6 Feb 2026 | £200,000 |
| 14 Mar 2008 | £210,000 |
Flat 54, Stokes Court, Diploma Avenue, East Finchley, London N2 8NX
| Today | See what it's worth now |
| 6 Feb 2026 | £314,000 |
| 15 Jan 2008 | £180,000 |
16, Deanery Close, East Finchley, London N2 8NS
| Today | See what it's worth now |
| 5 Feb 2026 | £298,000 |
No other historical records.
66, Aylmer Road, Hornsey, London N2 0PL
| Today | See what it's worth now |
| 30 Jan 2026 | £605,000 |
| 24 May 2010 | £322,750 |
No other historical records.
44, Lankaster Gardens, East Finchley, London N2 9AJ
| Today | See what it's worth now |
| 30 Jan 2026 | £625,000 |
| 3 Apr 2008 | £200,000 |
No other historical records.
72, Winnington Road, East Finchley, London N2 0TX
| Today | See what it's worth now |
| 26 Jan 2026 | £4,500,000 |
No other historical records.
6, Elmshurst Crescent, East Finchley, London N2 0LP

| Today | See what it's worth now |
| 23 Jan 2026 | £390,000 |
| 20 Sep 2019 | £390,000 |

Source Acknowledgement: © Crown copyright. England and Wales house price data is publicly available information produced by the HM Land Registry.This material was last updated on 9 July 2026. It covers the period from 1 January 1995 to 30 April 2026 and contains property transactions which have been registered during that period. Contains HM Land Registry data © Crown copyright and database right 2026. This data is licensed under the Open Government Licence v3.0.
Disclaimer: Rightmove.co.uk provides this HM Land Registry data "as is". The burden for fitness of the data relies completely with the user and is provided for informational purposes only. No warranty, express or implied, is given relating to the accuracy of content of the HM Land Registry data and Rightmove does not accept any liability for error or omission. If you have found an error with the data or need further information please contact HM Land Registry.
Permitted Use: Viewers of this Information are granted permission to access this Crown copyright material and to download it onto electronic, magnetic, optical or similar storage media provided that such activities are for private research, study or in-house use only. Any other use of the material requires the formal written permission of Land Registry which can be requested from us, and is subject to an additional licence and associated charge.
Rightmove takes no liability for your use of, or reliance on, Rightmove's Instant Valuation due to the limitations of our tracking tool listed here. Use of this tool is taken entirely at your own risk. All rights reserved.