
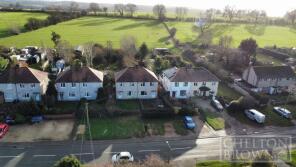
House Prices in East Haddon
House prices in East Haddon have an overall average of £432,273 over the last year.
The majority of properties sold in East Haddon during the last year were semi-detached properties, selling for an average price of £346,000. Detached properties sold for an average of £645,000, with terraced properties fetching £170,000.
Overall, the historical sold prices in East Haddon over the last year were 16% down on the previous year and 41% down on the 2023 peak of £734,167.
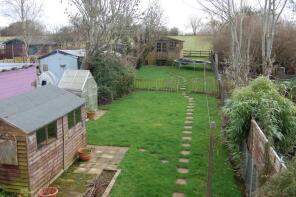
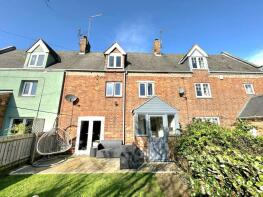
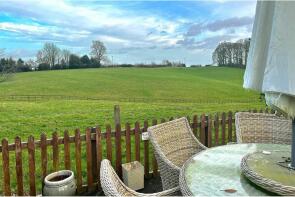
Properties Sold
4, The Old Dairy Farm, Church Lane, Northampton NN6 8DB
| Today | See what it's worth now |
| 1 Apr 2026 | £275,000 |
| 30 Sep 2021 | £260,000 |
29, Holdenby Road, Northampton NN6 8DH
| Today | See what it's worth now |
| 26 Mar 2026 | £210,000 |
| 15 Mar 2004 | £108,000 |
No other historical records.
Woodstock, Hall Gardens, Northampton NN6 8BL
| Today | See what it's worth now |
| 10 Mar 2026 | £615,000 |
| 21 Aug 2020 | £425,000 |
The Bothy, Mill Lane, Northampton NN6 8DX
| Today | See what it's worth now |
| 5 Dec 2025 | £305,000 |
| 12 May 2016 | £132,500 |
Holly Lodge, Church Lane, East Haddon NN6 8DB
| Today | See what it's worth now |
| 3 Dec 2025 | £700,000 |
No other historical records.
11, Tilbury Rise, East Haddon NN6 8BW
| Today | See what it's worth now |
| 31 Oct 2025 | £625,000 |
No other historical records.
The Nook, Mill Lane, Northampton NN6 8DX
| Today | See what it's worth now |
| 10 Sep 2025 | £260,000 |
| 28 Jun 2019 | £200,000 |
48, Holdenby Road, Northampton NN6 8DH
| Today | See what it's worth now |
| 10 Sep 2025 | £425,000 |
| 21 Oct 2005 | £197,500 |
5, Northfield Green, Northampton NN6 8BJ
| Today | See what it's worth now |
| 5 Sep 2025 | £170,000 |
| 10 Feb 2014 | £107,500 |
15, Tilbury Rise, Northampton NN6 8BW
| Today | See what it's worth now |
| 11 Aug 2025 | £640,000 |
| 5 Oct 2009 | £355,000 |
Butlers Cottage, Main Street, East Haddon NN6 8BU
| Today | See what it's worth now |
| 18 Jul 2025 | £530,000 |
No other historical records.
2, Fog Cottages, West Haddon Road, East Haddon NN6 8DP
| Today | See what it's worth now |
| 6 Jun 2025 | £267,500 |
No other historical records.
Eaton Cottage, Holdenby Road, East Haddon NN6 8JR
| Today | See what it's worth now |
| 21 May 2025 | £404,000 |
| 5 Oct 2016 | £210,000 |
Loughrigg, Church Lane, East Haddon NN6 8DB
| Today | See what it's worth now |
| 21 May 2025 | £562,500 |
No other historical records.
7, Orchard Close, Northampton NN6 8BZ
| Today | See what it's worth now |
| 28 Mar 2025 | £295,000 |
| 29 Jun 2001 | £86,000 |
No other historical records.
28, The Terrace, Church Lane, Northampton NN6 8DB
| Today | See what it's worth now |
| 28 Mar 2025 | £415,000 |
| 18 Jun 2008 | £180,000 |
No other historical records.
The Manor House, Main Street, East Haddon NN6 8BU
| Today | See what it's worth now |
| 5 Mar 2025 | £1,200,000 |
No other historical records.
17, Northfield Green, Northampton NN6 8BJ

| Today | See what it's worth now |
| 28 Feb 2025 | £760,000 |
| 24 Nov 2006 | £450,000 |
The Plough, Main Street, East Haddon NN6 8BU

| Today | See what it's worth now |
| 10 Jan 2025 | £705,000 |
No other historical records.
Ridgacre, Tilbury Road, Northampton NN6 8BX
| Today | See what it's worth now |
| 11 Oct 2024 | £508,500 |
| 29 Jul 1996 | £144,000 |
No other historical records.
35, Holdenby Road, Northampton NN6 8DH
| Today | See what it's worth now |
| 5 Sep 2024 | £275,000 |
| 24 Aug 2018 | £230,000 |
No other historical records.
29 Crabtree House, Tilbury Road, Northampton NN6 8BX

| Today | See what it's worth now |
| 4 Sep 2024 | £470,000 |
| 8 Oct 2009 | £250,000 |
26, The Terrace, Church Lane, Northampton NN6 8DB
| Today | See what it's worth now |
| 22 Jul 2024 | £312,000 |
| 7 Mar 2019 | £245,000 |
Source Acknowledgement: © Crown copyright. England and Wales house price data is publicly available information produced by the HM Land Registry.This material was last updated on 9 July 2026. It covers the period from 1 January 1995 to 30 April 2026 and contains property transactions which have been registered during that period. Contains HM Land Registry data © Crown copyright and database right 2026. This data is licensed under the Open Government Licence v3.0.
Disclaimer: Rightmove.co.uk provides this HM Land Registry data "as is". The burden for fitness of the data relies completely with the user and is provided for informational purposes only. No warranty, express or implied, is given relating to the accuracy of content of the HM Land Registry data and Rightmove does not accept any liability for error or omission. If you have found an error with the data or need further information please contact HM Land Registry.
Permitted Use: Viewers of this Information are granted permission to access this Crown copyright material and to download it onto electronic, magnetic, optical or similar storage media provided that such activities are for private research, study or in-house use only. Any other use of the material requires the formal written permission of Land Registry which can be requested from us, and is subject to an additional licence and associated charge.
Rightmove takes no liability for your use of, or reliance on, Rightmove's Instant Valuation due to the limitations of our tracking tool listed here. Use of this tool is taken entirely at your own risk. All rights reserved.