
House Prices in East Mains Of Burnside
House prices in East Mains Of Burnside have an overall average of £224,246 over the last year.
The majority of properties sold in East Mains Of Burnside during the last year were detached properties, selling for an average price of £293,785. Flats sold for an average of £92,389, with semi-detached properties fetching £216,488.
Overall, the historical sold prices in East Mains Of Burnside over the last year were 8% up on the previous year and 16% up on the 2022 peak of £193,948.
Properties Sold
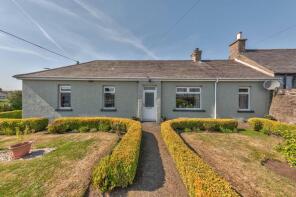
1, Mains Of Craichie Farm Cottages, Craichie, Forfar DD8 2LU
| Today | See what it's worth now |
| 24 Dec 2025 | £183,000 |
| 8 May 2017 | £130,000 |
No other historical records.
11, Priory Court, Forfar DD8 2EA

| Today | See what it's worth now |
| 22 Dec 2025 | £65,000 |
| 9 Mar 2021 | £40,000 |
No other historical records.
15, Priory Wynd, Gowanbank, Forfar DD8 2UQ

| Today | See what it's worth now |
| 22 Dec 2025 | £221,250 |
| 23 Oct 2006 | £158,000 |
No other historical records.
7b Teviot, The Den, Forfar DD8 2PY

| Today | See what it's worth now |
| 15 Dec 2025 | £280,000 |
| 27 Feb 2023 | £275,000 |
40, Yeaman Street, Forfar DD8 2JH

| Today | See what it's worth now |
| 11 Dec 2025 | £122,500 |
| 20 Dec 2019 | £100,000 |
6, The Square, Forfar DD8 2PZ

| Today | See what it's worth now |
| 10 Dec 2025 | £502,500 |
| 22 Oct 2012 | £90,000 |
43, Mcculloch Drive, Forfar DD8 2EB

| Today | See what it's worth now |
| 9 Dec 2025 | £240,250 |
| 23 Apr 2003 | £90,510 |
30, Dunnichen Avenue, Gowanbank, Forfar DD8 2UT

| Today | See what it's worth now |
| 8 Dec 2025 | £240,042 |
| 5 Jun 2015 | £188,000 |
No other historical records.
70c, South Street, Forfar DD8 2BR

| Today | See what it's worth now |
| 8 Dec 2025 | £137,000 |
| 26 Jun 2007 | £124,990 |
No other historical records.
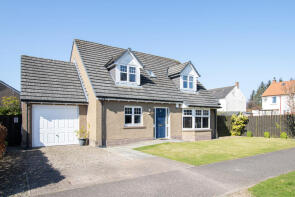
40, Idvies View, Letham DD8 2DU
| Today | See what it's worth now |
| 4 Dec 2025 | £300,000 |
No other historical records.
Cromar, Suttie Wynd, Letham DD8 2DP

| Today | See what it's worth now |
| 2 Dec 2025 | £218,500 |
No other historical records.
Kirkton House, Access From Zu468 Via Guthrie To Newton Of Guthrie Farm, Forfar DD8 2TP

| Today | See what it's worth now |
| 1 Dec 2025 | £450,000 |
| 16 Jun 2008 | £500,000 |
5, Strathmore Court, Kirkton Place, Forfar DD8 2DX

| Today | See what it's worth now |
| 25 Nov 2025 | £105,000 |
| 28 Apr 2023 | £89,000 |
49, Lordburn Place, Forfar DD8 2DE

| Today | See what it's worth now |
| 24 Nov 2025 | £140,000 |
| 13 Mar 2008 | £110,000 |
No other historical records.
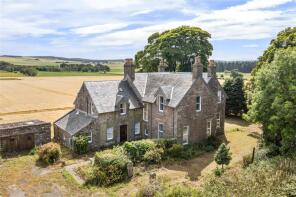
Seggieden, Whigstreet, Forfar DD8 2JQ
| Today | See what it's worth now |
| 24 Nov 2025 | £336,000 |
No other historical records.
14a, East Hemming Street, Forfar DD8 2PT

| Today | See what it's worth now |
| 21 Nov 2025 | £245,000 |
| 3 Apr 2007 | £175,000 |
22, Nursery Street, Forfar DD8 2HP

| Today | See what it's worth now |
| 21 Nov 2025 | £110,000 |
| 21 Mar 2006 | £80,260 |
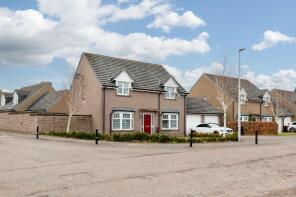
38, Idvies View, Forfar DD8 2DU
| Today | See what it's worth now |
| 20 Nov 2025 | £335,000 |
| 10 Apr 2024 | £275,750 |
19, Back Wynd, Forfar DD8 3AQ

| Today | See what it's worth now |
| 19 Nov 2025 | £98,500 |
No other historical records.
100, Restenneth Drive, Forfar DD8 2DB

| Today | See what it's worth now |
| 17 Nov 2025 | £99,950 |
No other historical records.
Dumbarrow Cottage, Dumbarrow, Letham DD8 2SW

| Today | See what it's worth now |
| 10 Nov 2025 | £475,000 |
| 16 Nov 2016 | £430,000 |
No other historical records.
12, Helen Street, Forfar DD8 2HW

| Today | See what it's worth now |
| 6 Nov 2025 | £125,000 |
No other historical records.
64, Lour Road, Forfar DD8 2BA
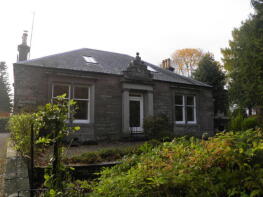
| Today | See what it's worth now |
| 6 Nov 2025 | £405,000 |
| 16 Dec 2014 | £230,000 |
No other historical records.
Linden Cottage, Bowriefauld, Letham DD8 2LX

| Today | See what it's worth now |
| 3 Nov 2025 | £265,000 |
No other historical records.
49, Duncan Road, Forfar DD8 2PN

| Today | See what it's worth now |
| 30 Oct 2025 | £235,000 |
| 17 Dec 2012 | £157,000 |
Source Acknowledgement: © Crown copyright. Scottish house price data is publicly available information produced by the Registers of Scotland. Material has been reproduced with the permission of the Keeper of the Registers of Scotland and contains data compiled by Registers of Scotland. For further information, please contact data@ros.gov.uk. Please note the dates shown here relate to the property's registered date not sold date.This material was last updated on 4 February 2026. It covers the period from 8 December 1987 to 31 December 2025 and contains property transactions which have been registered during that period.
Disclaimer: Rightmove.co.uk provides this Registers of Scotland data "as is". The burden for fitness of the data relies completely with the user and is provided for informational purposes only. No warranty, express or implied, is given relating to the accuracy of content of the Registers of Scotland data and Rightmove plc does not accept any liability for error or omission. If you have found an error with the data or need further information please contact data@ros.gov.uk
Permitted Use: The Registers of Scotland allows the reproduction of the data which it provides to Rightmove.co.uk free of charge in any format or medium only for research, private study or for internal circulation within an organisation. This is subject to it being reproduced accurately and not used in a misleading context. The material must be acknowledged as Crown Copyright. You are not allowed to use this information for commercial purposes, nor must you copy, distribute, sell or publish the data in any way. For any other use of this material, please apply to the Registers of Scotland for a licence. You can do this online at www.ros.gov.uk, by email at data@ros.gov.uk or by writing to Business Development, Registers of Scotland, Meadowbank House, 153 London Road, Edinburgh EH8 7AU.
Map data ©OpenStreetMap contributors.
Rightmove takes no liability for your use of, or reliance on, Rightmove's Instant Valuation due to the limitations of our tracking tool listed here. Use of this tool is taken entirely at your own risk. All rights reserved.
