
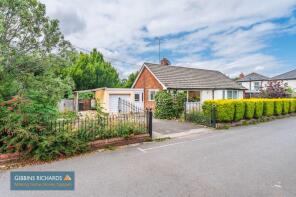
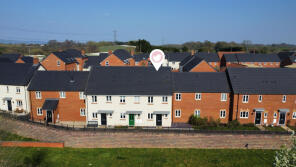
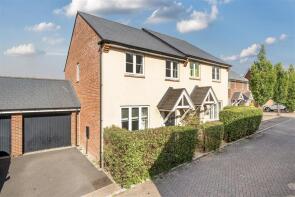
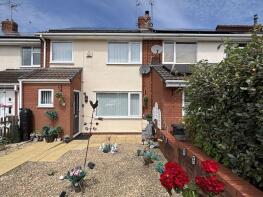
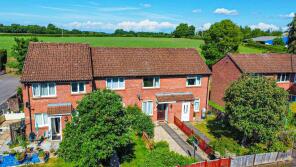
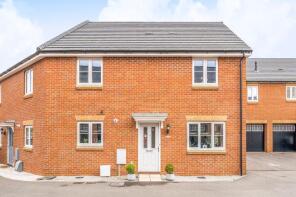
House Prices in East Nynehead
House prices in East Nynehead have an overall average of £329,387 over the last year.
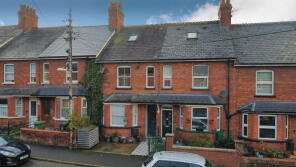
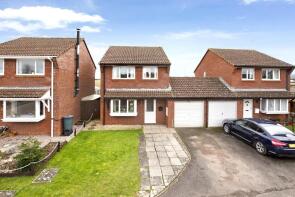
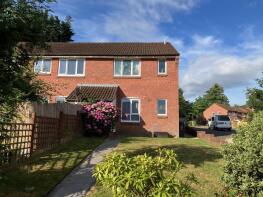
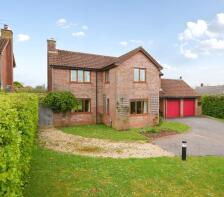
The majority of properties sold in East Nynehead during the last year were terraced properties, selling for an average price of £249,134. Detached properties sold for an average of £499,312, with semi-detached properties fetching £286,763.
Overall, the historical sold prices in East Nynehead over the last year were 3% down on the previous year and 9% down on the 2022 peak of £362,952.
Properties Sold
Old Orchard, Holcombe Rogus TA21 0NE

| Today | See what it's worth now |
| 19 Feb 2026 | £711,000 |
No other historical records.
2a, Springfield Road, Wellington TA21 8LG
| Today | See what it's worth now |
| 19 Feb 2026 | £240,000 |
| 23 Feb 2012 | £155,000 |
34, Bovet Street, Wellington TA21 8JL
| Today | See what it's worth now |
| 17 Feb 2026 | £315,200 |
| 15 Jan 2019 | £200,000 |
21, High Path, Station Road, Wellington TA21 8NH

| Today | See what it's worth now |
| 10 Feb 2026 | £445,000 |
| 22 Apr 2022 | £425,000 |
15, Prices Avenue, Wellington TA21 8DS

| Today | See what it's worth now |
| 5 Feb 2026 | £295,000 |
| 30 Jun 2016 | £212,950 |
No other historical records.
11, Holyoake Street, Wellington TA21 8LD


| Today | See what it's worth now |
| 4 Feb 2026 | £265,000 |
| 23 Apr 2021 | £218,000 |
62, Richards Close, Wellington TA21 0BE
| Today | See what it's worth now |
| 2 Feb 2026 | £244,000 |
| 10 Aug 2007 | £160,000 |
5 Rose Cottage, Heathfield, Langford Budville Road, Langford Budville, Wellington TA21 0RP
| Today | See what it's worth now |
| 30 Jan 2026 | £435,000 |
| 10 Aug 2016 | £321,000 |
18, Wardleworth Way, Wellington TA21 0BB
| Today | See what it's worth now |
| 22 Jan 2026 | £70,000 |
| 23 Apr 2015 | £79,500 |
Lyndon, Langford Budville Road, Langford Budville, Wellington TA21 0QZ
| Today | See what it's worth now |
| 9 Jan 2026 | £472,000 |
| 18 Jul 2017 | £435,000 |
44, Thomas Fox Road, Tonedale, Wellington TA21 0DF

| Today | See what it's worth now |
| 19 Dec 2025 | £210,000 |
No other historical records.
6, Nynehead Mews Nynehead Court, Chipley Road, Nynehead, Wellington TA21 0BN
| Today | See what it's worth now |
| 19 Dec 2025 | £465,000 |
| 11 Oct 2022 | £495,000 |
33, Gregorys Crescent, Wellington TA21 8FB

| Today | See what it's worth now |
| 19 Dec 2025 | £149,500 |
| 13 Sep 2022 | £107,500 |
No other historical records.
Flat 8, Weare House, Thomas Fox Road, Tonedale, Wellington TA21 0DQ
| Today | See what it's worth now |
| 18 Dec 2025 | £139,000 |
| 4 Oct 2018 | £119,000 |
No other historical records.
16, Mill Path, Tonedale, Wellington TA21 0DE
| Today | See what it's worth now |
| 15 Dec 2025 | £225,000 |
| 9 Oct 2020 | £175,000 |
44, Proctor Road, Wellington TA21 8FE
| Today | See what it's worth now |
| 15 Dec 2025 | £325,000 |
| 15 Dec 2017 | £244,950 |
No other historical records.
37, Gamlin Close, Wellington TA21 8FN
| Today | See what it's worth now |
| 15 Dec 2025 | £328,000 |
| 27 Aug 2021 | £278,000 |
No other historical records.
Stawley Farm, Ham Hill, Stawley, Wellington TA21 0HN
| Today | See what it's worth now |
| 15 Dec 2025 | £870,000 |
| 23 Jul 2004 | £562,500 |
30, Gregorys Crescent, Wellington TA21 8FB
| Today | See what it's worth now |
| 15 Dec 2025 | £265,000 |
| 16 Oct 2015 | £196,950 |
No other historical records.
3, Burchills Close, Lower Westford, Wellington TA21 0DP
| Today | See what it's worth now |
| 9 Dec 2025 | £240,000 |
No other historical records.
82, Wardleworth Way, Wellington TA21 0BB
| Today | See what it's worth now |
| 9 Dec 2025 | £185,000 |
| 18 Nov 2020 | £156,000 |
23, Thomas Fox Road, Tonedale, Wellington TA21 0DF
| Today | See what it's worth now |
| 5 Dec 2025 | £267,500 |
| 18 Dec 2020 | £222,500 |
23, Mitchell Street, Wellington TA21 8LF
| Today | See what it's worth now |
| 28 Nov 2025 | £290,000 |
| 1 Mar 2016 | £148,000 |
No other historical records.
13, Riverside, Wellington TA21 8LJ
| Today | See what it's worth now |
| 27 Nov 2025 | £220,000 |
| 8 Jul 2016 | £153,000 |
79, Waterloo Road, Wellington TA21 8JQ
| Today | See what it's worth now |
| 19 Nov 2025 | £445,000 |
| 1 Nov 2018 | £300,000 |
Source Acknowledgement: © Crown copyright. England and Wales house price data is publicly available information produced by the HM Land Registry.This material was last updated on 9 April 2026. It covers the period from 1 January 1995 to 27 February 2026 and contains property transactions which have been registered during that period. Contains HM Land Registry data © Crown copyright and database right 2026. This data is licensed under the Open Government Licence v3.0.
Disclaimer: Rightmove.co.uk provides this HM Land Registry data "as is". The burden for fitness of the data relies completely with the user and is provided for informational purposes only. No warranty, express or implied, is given relating to the accuracy of content of the HM Land Registry data and Rightmove does not accept any liability for error or omission. If you have found an error with the data or need further information please contact HM Land Registry.
Permitted Use: Viewers of this Information are granted permission to access this Crown copyright material and to download it onto electronic, magnetic, optical or similar storage media provided that such activities are for private research, study or in-house use only. Any other use of the material requires the formal written permission of Land Registry which can be requested from us, and is subject to an additional licence and associated charge.
Map data ©OpenStreetMap contributors.
Rightmove takes no liability for your use of, or reliance on, Rightmove's Instant Valuation due to the limitations of our tracking tool listed here. Use of this tool is taken entirely at your own risk. All rights reserved.