
House Prices in Eastfield
House prices in Eastfield have an overall average of £166,632 over the last year.
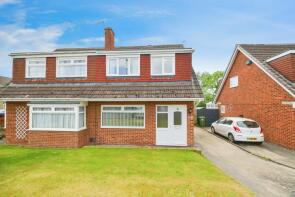
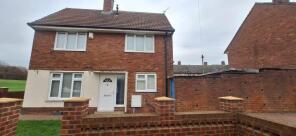
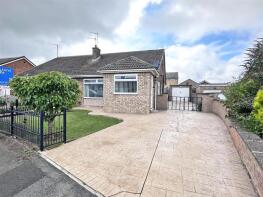
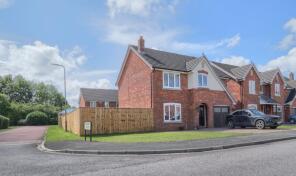
The majority of properties sold in Eastfield during the last year were semi-detached properties, selling for an average price of £152,345. Terraced properties sold for an average of £118,833, with detached properties fetching £282,955.
Overall, the historical sold prices in Eastfield over the last year were 12% up on the previous year and 31% up on the 2022 peak of £127,168.
Properties Sold
15, New Earswick Street, Stockton-on-tees TS19 8EU
| Today | See what it's worth now |
| 7 Apr 2026 | £146,500 |
| 30 Apr 2021 | £110,000 |
172a, High Newham Road, Stockton-on-tees TS19 8NT
| Today | See what it's worth now |
| 30 Mar 2026 | £130,000 |
| 7 Oct 2021 | £130,000 |
1, George Stephenson Boulevard, Stockton-on-tees TS19 8GD
| Today | See what it's worth now |
| 30 Mar 2026 | £151,000 |
| 7 Nov 2025 | £100,000 |
36, Marske Lane, Stockton-on-tees TS19 8XD
| Today | See what it's worth now |
| 27 Mar 2026 | £148,750 |
| 26 Feb 2025 | £94,000 |
8, Einstein Way, Stockton-on-tees TS19 8GP
| Today | See what it's worth now |
| 27 Mar 2026 | £80,000 |
| 30 Jul 2018 | £78,000 |
6, Lutyens Square, Stockton-on-tees TS19 8ZF
| Today | See what it's worth now |
| 13 Mar 2026 | £150,000 |
| 12 Jul 2023 | £135,000 |
1, Clover Court, Stockton-on-tees TS19 8FQ
| Today | See what it's worth now |
| 6 Mar 2026 | £243,000 |
| 20 Sep 2013 | £160,000 |
22, Poppy Lane, Stockton-on-tees TS19 8FL
| Today | See what it's worth now |
| 20 Feb 2026 | £257,000 |
| 23 Mar 2001 | £94,995 |
No other historical records.
5, Crookhall Walk, Stockton-on-tees TS19 8QG
| Today | See what it's worth now |
| 13 Feb 2026 | £88,000 |
| 17 Apr 2014 | £55,000 |
4, Etherley Walk, Stockton-on-tees TS19 8JD
| Today | See what it's worth now |
| 13 Feb 2026 | £54,000 |
| 4 Nov 2009 | £53,000 |
No other historical records.
4, Roecliffe Grove, Stockton-on-tees TS19 8JU
| Today | See what it's worth now |
| 10 Feb 2026 | £205,000 |
| 30 Sep 2022 | £172,500 |
9, Briardene Walk, Stockton-on-tees TS19 8UU
| Today | See what it's worth now |
| 9 Feb 2026 | £148,000 |
| 22 Jun 2012 | £92,000 |
10, Meadowsweet Lane, Stockton-on-tees TS19 8EL
| Today | See what it's worth now |
| 23 Jan 2026 | £140,000 |
| 7 Dec 2018 | £105,000 |
26, Port Sunlight Grove, Stockton-on-tees TS19 8LE
| Today | See what it's worth now |
| 14 Jan 2026 | £120,000 |
| 30 Sep 2021 | £95,000 |
62, Malton Drive, Stockton-on-tees TS19 8TU
| Today | See what it's worth now |
| 9 Jan 2026 | £165,000 |
| 17 Oct 2003 | £88,000 |
No other historical records.
30, Selwyn Drive, Stockton-on-tees TS19 8XF

| Today | See what it's worth now |
| 8 Jan 2026 | £180,000 |
| 14 Mar 2008 | £125,000 |
33, Bevan Close, Stockton-on-tees TS19 8RF
| Today | See what it's worth now |
| 5 Jan 2026 | £176,000 |
| 13 Oct 2006 | £149,995 |
No other historical records.
20, Gentian Way, Stockton-on-tees TS19 8FH
| Today | See what it's worth now |
| 19 Dec 2025 | £163,500 |
| 24 Nov 2022 | £124,000 |
30, Snowdrop Close, Stockton-on-tees TS19 8FG
| Today | See what it's worth now |
| 19 Dec 2025 | £322,500 |
| 7 Dec 2001 | £119,950 |
No other historical records.
8, Cotgarth Way, Stockton-on-tees TS19 8XG
| Today | See what it's worth now |
| 16 Dec 2025 | £150,000 |
No other historical records.
20, Chilton Close, Stockton-on-tees TS19 8SS
| Today | See what it's worth now |
| 16 Dec 2025 | £100,000 |
| 25 Feb 2022 | £85,000 |
No other historical records.
22, Norton Drive, Stockton-on-tees TS19 8TS
| Today | See what it's worth now |
| 15 Dec 2025 | £149,000 |
| 10 Nov 2017 | £115,000 |
8, Poppy Lane, Stockton-on-tees TS19 8FL
| Today | See what it's worth now |
| 8 Dec 2025 | £300,000 |
| 23 Mar 2016 | £195,000 |
Source Acknowledgement: © Crown copyright. England and Wales house price data is publicly available information produced by the HM Land Registry.This material was last updated on 15 May 2026. It covers the period from 1 January 1995 to 31 March 2026 and contains property transactions which have been registered during that period. Contains HM Land Registry data © Crown copyright and database right 2026. This data is licensed under the Open Government Licence v3.0.
Disclaimer: Rightmove.co.uk provides this HM Land Registry data "as is". The burden for fitness of the data relies completely with the user and is provided for informational purposes only. No warranty, express or implied, is given relating to the accuracy of content of the HM Land Registry data and Rightmove does not accept any liability for error or omission. If you have found an error with the data or need further information please contact HM Land Registry.
Permitted Use: Viewers of this Information are granted permission to access this Crown copyright material and to download it onto electronic, magnetic, optical or similar storage media provided that such activities are for private research, study or in-house use only. Any other use of the material requires the formal written permission of Land Registry which can be requested from us, and is subject to an additional licence and associated charge.
Rightmove takes no liability for your use of, or reliance on, Rightmove's Instant Valuation due to the limitations of our tracking tool listed here. Use of this tool is taken entirely at your own risk. All rights reserved.