
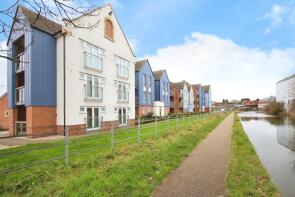
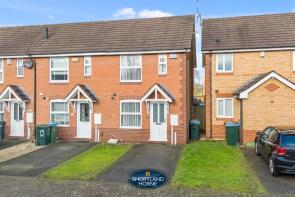
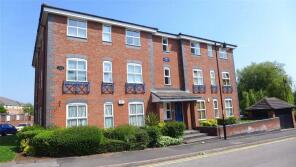
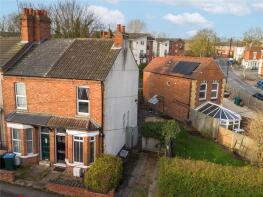
House Prices in Edgwick
House prices in Edgwick have an overall average of £160,938 over the last year.
The majority of properties sold in Edgwick during the last year were terraced properties, selling for an average price of £157,961. Flats sold for an average of £151,429, with semi-detached properties fetching £222,500.
Overall, the historical sold prices in Edgwick over the last year were 5% up on the previous year and 3% down on the 2022 peak of £165,574.
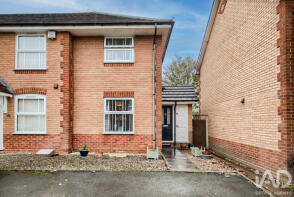
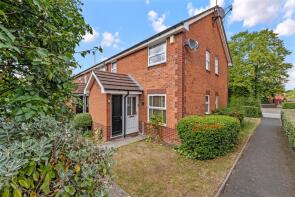
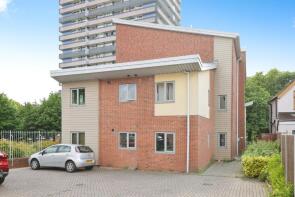
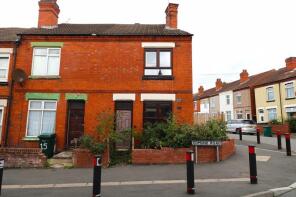
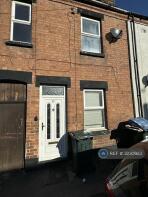
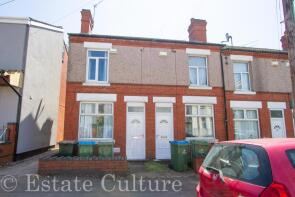
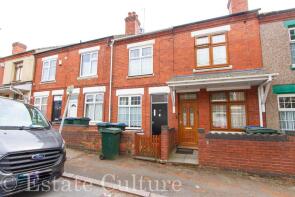
Properties Sold
18, Spindle Street, Coventry CV1 4NP
| Today | See what it's worth now |
| 19 Mar 2026 | £290,000 |
No other historical records.
99, Dorset Road, Coventry CV1 4ED
| Today | See what it's worth now |
| 6 Mar 2026 | £108,750 |
No other historical records.
24, Hawksworth Drive, Coventry CV1 4PX
| Today | See what it's worth now |
| 12 Feb 2026 | £170,000 |
| 6 Jul 1998 | £37,000 |
No other historical records.
5, Collett Walk, Coventry CV1 4PT
| Today | See what it's worth now |
| 23 Jan 2026 | £166,000 |
| 1 Nov 2002 | £65,500 |
3, Mandara Point, Drapers Fields, Coventry CV1 4AF
| Today | See what it's worth now |
| 14 Jan 2026 | £152,500 |
| 21 Dec 2006 | £165,000 |
No other historical records.
17, Edmund Road, Coventry CV1 4JE
| Today | See what it's worth now |
| 14 Jan 2026 | £114,500 |
No other historical records.
5, Leicester Causeway, Coventry CV1 4GU
| Today | See what it's worth now |
| 19 Dec 2025 | £142,500 |
| 18 Nov 2005 | £63,500 |
No other historical records.
11, Somerset Road, Coventry CV1 4EG

| Today | See what it's worth now |
| 5 Dec 2025 | £125,000 |
| 18 Dec 2009 | £75,000 |
No other historical records.
5, Mandara Point, Drapers Fields, Coventry CV1 4AF
| Today | See what it's worth now |
| 28 Nov 2025 | £125,000 |
| 29 Dec 2006 | £139,950 |
No other historical records.
32, George Eliot Road, Coventry CV1 4HU
| Today | See what it's worth now |
| 21 Nov 2025 | £156,000 |
| 16 Nov 2022 | £117,000 |
No other historical records.
14, The Cable Yard, Electric Wharf, Coventry CV1 4HA
| Today | See what it's worth now |
| 13 Nov 2025 | £225,000 |
No other historical records.
6, Somerset Road, Coventry CV1 4EE

| Today | See what it's worth now |
| 28 Oct 2025 | £150,000 |
| 23 May 2003 | £63,000 |
No other historical records.
19, Hawksworth Drive, Coventry CV1 4PX

| Today | See what it's worth now |
| 20 Oct 2025 | £195,000 |
| 30 Aug 2017 | £144,000 |
No other historical records.
Apartment 6, 1 Progress House, Quayside Court, Coventry CV1 4NF
| Today | See what it's worth now |
| 9 Oct 2025 | £162,500 |
No other historical records.
14, Edmund Road, Coventry CV1 4JE
| Today | See what it's worth now |
| 26 Sep 2025 | £159,500 |
| 9 Apr 2021 | £140,000 |
Apartment 2, 5 Potters House, Quayside Court, Coventry CV1 4NJ
| Today | See what it's worth now |
| 25 Sep 2025 | £162,000 |
| 24 Feb 2017 | £174,995 |
No other historical records.
16, Dorset Road, Coventry CV1 4EH
| Today | See what it's worth now |
| 22 Sep 2025 | £123,000 |
No other historical records.
5, Canal View, Coventry CV1 4LQ

| Today | See what it's worth now |
| 19 Sep 2025 | £250,000 |
| 24 Sep 2018 | £270,000 |
21, Hawksworth Drive, Coventry CV1 4PX
| Today | See what it's worth now |
| 29 Aug 2025 | £195,000 |
| 12 Feb 1996 | £46,000 |
No other historical records.
3, Coundon Road, Coventry CV1 4AR
| Today | See what it's worth now |
| 21 Aug 2025 | £126,000 |
| 12 Oct 2022 | £360,000 |
No other historical records.
24, Drapers Fields, Coventry CV1 4RB
| Today | See what it's worth now |
| 18 Aug 2025 | £103,000 |
| 7 Oct 2020 | £88,500 |
122, George Street, Coventry CV1 4HD
| Today | See what it's worth now |
| 7 Aug 2025 | £70,000 |
| 2 Oct 2020 | £90,000 |
No other historical records.
43, Somerset Road, Coventry CV1 4EG
| Today | See what it's worth now |
| 4 Aug 2025 | £110,000 |
| 10 Aug 2012 | £73,000 |

Source Acknowledgement: © Crown copyright. England and Wales house price data is publicly available information produced by the HM Land Registry.This material was last updated on 9 July 2026. It covers the period from 1 January 1995 to 30 April 2026 and contains property transactions which have been registered during that period. Contains HM Land Registry data © Crown copyright and database right 2026. This data is licensed under the Open Government Licence v3.0.
Disclaimer: Rightmove.co.uk provides this HM Land Registry data "as is". The burden for fitness of the data relies completely with the user and is provided for informational purposes only. No warranty, express or implied, is given relating to the accuracy of content of the HM Land Registry data and Rightmove does not accept any liability for error or omission. If you have found an error with the data or need further information please contact HM Land Registry.
Permitted Use: Viewers of this Information are granted permission to access this Crown copyright material and to download it onto electronic, magnetic, optical or similar storage media provided that such activities are for private research, study or in-house use only. Any other use of the material requires the formal written permission of Land Registry which can be requested from us, and is subject to an additional licence and associated charge.
Rightmove takes no liability for your use of, or reliance on, Rightmove's Instant Valuation due to the limitations of our tracking tool listed here. Use of this tool is taken entirely at your own risk. All rights reserved.