
House Prices in Mount Grange, Edinburgh, EH9
House prices in Mount Grange have an overall average of £137,897 over the last year.
Overall, the historical sold prices in Mount Grange over the last year were 3% down on the previous year and 4% down on the 2021 peak of £144,222.
Properties Sold
Flat 123, 1 Homeross House, Mount Grange, Morningside, Edinburgh EH9 2QZ

| Today | See what it's worth now |
| 10 Jun 2025 | £150,550 |
| 11 Feb 2025 | £132,500 |
Flat 127, Homeross House, Mount Grange, Morningside, Edinburgh EH9 2QZ
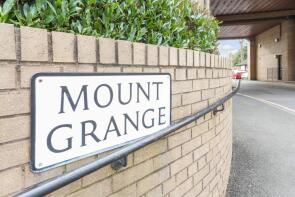
| Today | See what it's worth now |
| 9 Jun 2025 | £122,000 |
No other historical records.
Flat 102, Homeross House, Mount Grange, Morningside, Edinburgh EH9 2QY
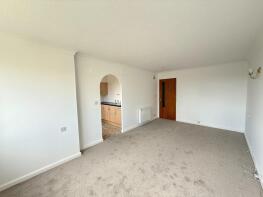
| Today | See what it's worth now |
| 16 Jan 2025 | £95,000 |
| 5 May 2021 | £125,000 |
Flat 104, 1 Homeross House, Mount Grange, Morningside, Edinburgh EH9 2QY

| Today | See what it's worth now |
| 16 Jul 2024 | £160,000 |
| 19 May 2011 | £95,000 |
Flat 32, 1 Homeross House, Mount Grange, Morningside, Edinburgh EH9 2QX

| Today | See what it's worth now |
| 10 Jul 2024 | £160,000 |
No other historical records.
Flat 107, 1 Homeross House, Mount Grange, Morningside, Edinburgh EH9 2QY
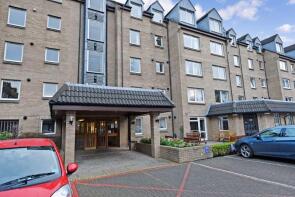
| Today | See what it's worth now |
| 3 Jun 2024 | £145,500 |
| 24 Jul 2023 | £139,500 |
Flat 137, 1 Homeross House, Mount Grange, Morningside, Edinburgh EH9 2QZ
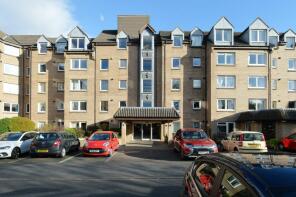
| Today | See what it's worth now |
| 30 Apr 2024 | £135,135 |
| 13 Oct 2010 | £100,000 |
Flat 40, Homeross House, Mount Grange, Morningside, Edinburgh EH9 2QX
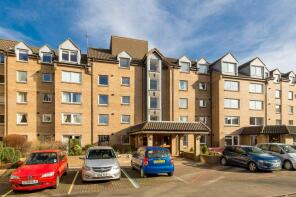
| Today | See what it's worth now |
| 22 Apr 2024 | £138,000 |
| 3 Apr 2023 | £131,000 |
Flat 73, 1 Homeross House, Mount Grange, Morningside, Edinburgh EH9 2QY
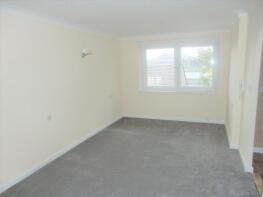
| Today | See what it's worth now |
| 10 Apr 2024 | £120,000 |
| 5 Feb 2024 | £130,000 |
Flat 138, 1 Homeross House, Mount Grange, Morningside, Edinburgh EH9 2QZ

| Today | See what it's worth now |
| 12 Feb 2024 | £115,000 |
No other historical records.
Flat 28, 1 Homeross House, Mount Grange, Morningside, Edinburgh EH9 2QX

| Today | See what it's worth now |
| 18 Jan 2024 | £122,500 |
| 10 Nov 2015 | £86,000 |
Flat 72, 1 Homeross House, Mount Grange, Morningside, Edinburgh EH9 2QY

| Today | See what it's worth now |
| 13 Sep 2023 | £140,000 |
No other historical records.
Flat 110, 1 Homeross House, Mount Grange, Morningside, Edinburgh EH9 2QY
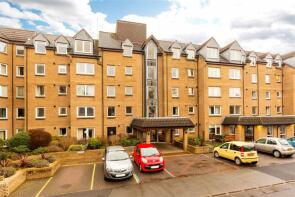
| Today | See what it's worth now |
| 24 Aug 2023 | £211,250 |
| 10 Oct 2003 | £120,000 |
No other historical records.
Flat 101, 1 Homeross House, Mount Grange, Morningside, Edinburgh EH9 2QY
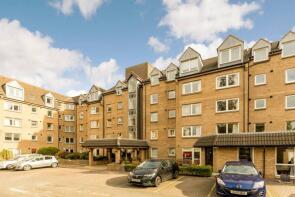
| Today | See what it's worth now |
| 17 Jul 2023 | £138,000 |
| 26 Aug 2016 | £102,000 |
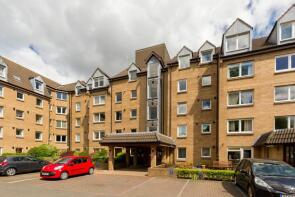
Flat 58, 1 Homeross House, Mount Grange, Morningside, Edinburgh EH9 2QY
| Today | See what it's worth now |
| 13 Jul 2023 | £125,000 |
| 17 Feb 2005 | £69,300 |
No other historical records.
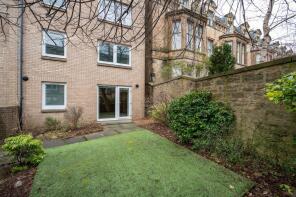
3, Mount Grange, Morningside, Edinburgh EH9 2QX
| Today | See what it's worth now |
| 3 May 2023 | £205,000 |
| 24 Dec 2010 | £85,000 |
No other historical records.
Flat 112, 1 Homeross House, Mount Grange, Morningside, Edinburgh EH9 2QY

| Today | See what it's worth now |
| 6 Dec 2022 | £120,000 |
| 22 May 2012 | £92,000 |
Flat 118, 1 Homeross House, Mount Grange, Morningside, Edinburgh EH9 2QY

| Today | See what it's worth now |
| 27 Oct 2022 | £180,000 |
| 28 Feb 2018 | £162,777 |
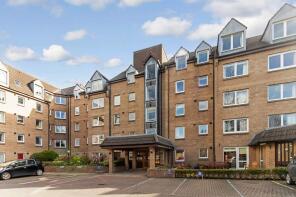
Flat 36, Homeross House, Mount Grange, Morningside, Edinburgh EH9 2QX
| Today | See what it's worth now |
| 8 Aug 2022 | £135,000 |
| 12 Apr 2018 | £141,259 |
No other historical records.
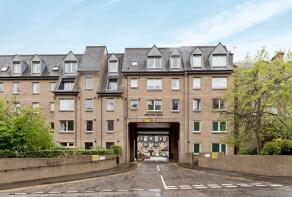
Flat 61, 1 Homeross House, Mount Grange, Morningside, Edinburgh EH9 2QY
| Today | See what it's worth now |
| 6 Jul 2022 | £110,000 |
| 25 Aug 2015 | £99,995 |
Flat 88, 1 Homeross House, Mount Grange, Morningside, Edinburgh EH9 2QY
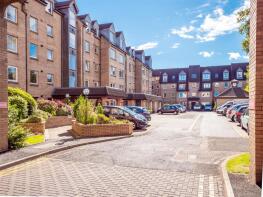
| Today | See what it's worth now |
| 29 Apr 2022 | £135,000 |
No other historical records.
Flat 85, 1 Homeross House, Mount Grange, Morningside, Edinburgh EH9 2QY

| Today | See what it's worth now |
| 31 Mar 2022 | £100,000 |
No other historical records.
Flat 79, 1 Homeross House, Mount Grange, Morningside, Edinburgh EH9 2QY
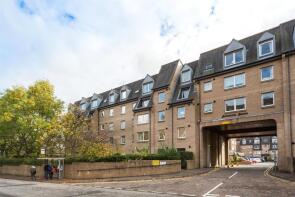
| Today | See what it's worth now |
| 16 Mar 2022 | £178,000 |
| 17 Dec 2015 | £130,000 |
Flat 115, 1 Homeross House, Mount Grange, Morningside, Edinburgh EH9 2QY

| Today | See what it's worth now |
| 16 Feb 2022 | £145,000 |
| 18 May 2016 | £122,000 |
No other historical records.
Flat 84, 1 Homeross House, Mount Grange, Morningside, Edinburgh EH9 2QY

| Today | See what it's worth now |
| 3 Nov 2021 | £110,000 |
| 5 Feb 2016 | £72,000 |
Find out how much your property is worth
The following agents can provide you with a free, no-obligation valuation. Simply select the ones you'd like to hear from.
Sponsored
All featured agents have paid a fee to promote their valuation expertise.

Truscott Property
Edinburgh

McEwan Fraser Legal
Edinburgh

Aberdein Considine
Edinburgh

Savills
Edinburgh

Burgh Property
Edinburgh

MOV8 Real Estate
Scotland Head Office
Get ready with a Mortgage in Principle
- Personalised result in just 20 minutes
- Find out how much you can borrow
- Get viewings faster with agents
- No impact on your credit score
What's your property worth?
Source Acknowledgement: © Crown copyright. Scottish house price data is publicly available information produced by the Registers of Scotland. Material has been reproduced with the permission of the Keeper of the Registers of Scotland and contains data compiled by Registers of Scotland. For further information, please contact data@ros.gov.uk. Please note the dates shown here relate to the property's registered date not sold date.This material was last updated on 7 August 2025. It covers the period from 8 December 1987 to 30 June 2025 and contains property transactions which have been registered during that period.
Disclaimer: Rightmove.co.uk provides this Registers of Scotland data "as is". The burden for fitness of the data relies completely with the user and is provided for informational purposes only. No warranty, express or implied, is given relating to the accuracy of content of the Registers of Scotland data and Rightmove plc does not accept any liability for error or omission. If you have found an error with the data or need further information please contact data@ros.gov.uk
Permitted Use: The Registers of Scotland allows the reproduction of the data which it provides to Rightmove.co.uk free of charge in any format or medium only for research, private study or for internal circulation within an organisation. This is subject to it being reproduced accurately and not used in a misleading context. The material must be acknowledged as Crown Copyright. You are not allowed to use this information for commercial purposes, nor must you copy, distribute, sell or publish the data in any way. For any other use of this material, please apply to the Registers of Scotland for a licence. You can do this online at www.ros.gov.uk, by email at data@ros.gov.uk or by writing to Business Development, Registers of Scotland, Meadowbank House, 153 London Road, Edinburgh EH8 7AU.
Map data ©OpenStreetMap contributors.
Rightmove takes no liability for your use of, or reliance on, Rightmove's Instant Valuation due to the limitations of our tracking tool listed here. Use of this tool is taken entirely at your own risk. All rights reserved.
