
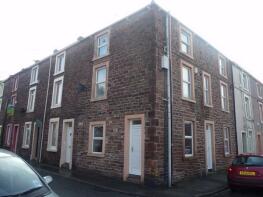
House Prices in Elbra
House prices in Elbra have an overall average of £178,542 over the last year.
The majority of properties sold in Elbra during the last year were detached properties, selling for an average price of £254,391. Semi-detached properties sold for an average of £167,483, with terraced properties fetching £113,754.
Overall, the historical sold prices in Elbra over the last year were 2% up on the previous year and 6% up on the 2023 peak of £167,971.
Properties Sold
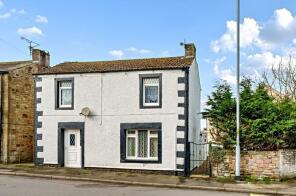
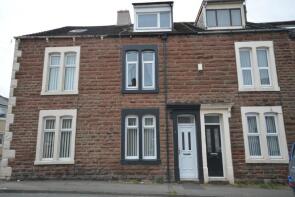
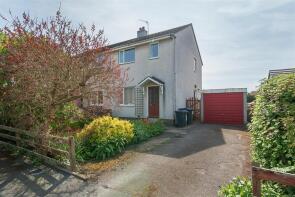
1, Craika Road, Maryport CA15 7EH
| Today | See what it's worth now |
| 15 Dec 2025 | £220,000 |
| 30 Jun 2023 | £159,639 |
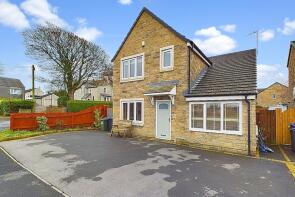
9, Elizabeth Terrace, Maryport CA15 7BB
| Today | See what it's worth now |
| 8 Dec 2025 | £140,000 |
| 21 Aug 2020 | £103,000 |
13, Sycamore Road, Maryport CA15 7AE
| Today | See what it's worth now |
| 8 Dec 2025 | £270,000 |
| 26 Mar 2021 | £210,000 |
No other historical records.
103, Central Road, Maryport CA15 7EP
| Today | See what it's worth now |
| 5 Dec 2025 | £80,000 |
| 24 Jul 2008 | £49,000 |
No other historical records.
6, Ramsay Terrace, Maryport CA15 7NY
| Today | See what it's worth now |
| 1 Dec 2025 | £95,000 |
| 10 Nov 2015 | £86,000 |
8, Laburnum Grove, Maryport CA15 7AP


| Today | See what it's worth now |
| 24 Nov 2025 | £205,000 |
| 9 Dec 2020 | £170,000 |
20, Elizabeth Street, Maryport CA15 7NZ
| Today | See what it's worth now |
| 21 Nov 2025 | £115,000 |
| 7 Jul 2000 | £31,000 |
No other historical records.
22, Craika Road, Maryport CA15 7EH
| Today | See what it's worth now |
| 20 Nov 2025 | £223,000 |
| 22 Oct 2021 | £190,000 |
9, Ewanrigg Brow, Maryport CA15 7QU
| Today | See what it's worth now |
| 14 Nov 2025 | £94,000 |
| 29 Jul 2016 | £64,500 |
1, Lyalls Place, Maryport CA15 7PF
| Today | See what it's worth now |
| 14 Nov 2025 | £74,500 |
| 14 Feb 2008 | £78,000 |
No other historical records.
29, Maryport Road, Maryport CA15 7EG
| Today | See what it's worth now |
| 11 Nov 2025 | £125,000 |
| 13 Mar 2012 | £87,500 |
42, St Mungos Close, Maryport CA15 7EZ

| Today | See what it's worth now |
| 7 Nov 2025 | £307,000 |
| 4 Apr 2014 | £217,750 |
No other historical records.
1, Victory Crescent, Maryport CA15 7LF
| Today | See what it's worth now |
| 7 Nov 2025 | £185,000 |
| 10 Apr 2019 | £131,000 |
No other historical records.
50, Central Road, Maryport CA15 7ER
| Today | See what it's worth now |
| 5 Nov 2025 | £120,000 |
| 29 Jun 2018 | £68,000 |
10, Ewanrigg Brow, Maryport CA15 7QU
| Today | See what it's worth now |
| 24 Oct 2025 | £90,000 |
| 15 Jul 2011 | £67,000 |
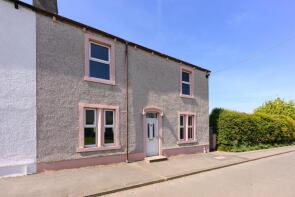
3, Heatherfields, Maryport CA15 7RS

| Today | See what it's worth now |
| 24 Oct 2025 | £130,000 |
| 20 Sep 2022 | £95,000 |
No other historical records.
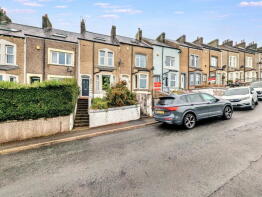
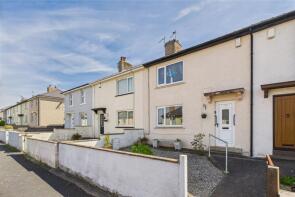
3, The Terrace, Row Brow, Maryport CA15 7JT
| Today | See what it's worth now |
| 24 Oct 2025 | £165,000 |
| 24 Jan 2013 | £112,000 |
91, Victory Crescent, Maryport CA15 7ND

| Today | See what it's worth now |
| 21 Oct 2025 | £80,000 |
No other historical records.
46, St Mungos Close, Maryport CA15 7EZ
| Today | See what it's worth now |
| 21 Oct 2025 | £245,000 |
| 25 Jul 2014 | £174,950 |
No other historical records.
105, Central Road, Maryport CA15 7EP
| Today | See what it's worth now |
| 17 Oct 2025 | £109,995 |
| 17 Mar 2023 | £58,000 |
25, Row Brow Park, Maryport CA15 7JU
| Today | See what it's worth now |
| 17 Oct 2025 | £137,500 |
| 16 Oct 2000 | £41,000 |
No other historical records.
1, Meadowlands, Maryport CA15 7EB
| Today | See what it's worth now |
| 10 Oct 2025 | £240,000 |
| 16 Feb 2018 | £187,000 |
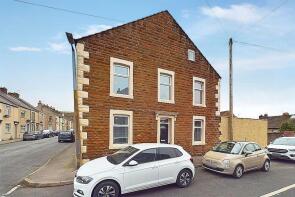
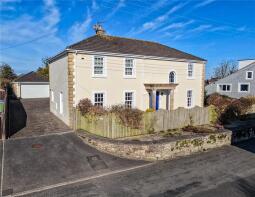
Sine Keld, Main Street, Maryport CA15 7HT
| Today | See what it's worth now |
| 2 Oct 2025 | £400,000 |
| 15 Aug 2012 | £275,000 |
No other historical records.
19, Greenwood Terrace, Maryport CA15 7QH
| Today | See what it's worth now |
| 26 Sep 2025 | £100,000 |
| 18 Jul 2007 | £83,000 |
No other historical records.
41, Went Meadows Close, Maryport CA15 7HN

| Today | See what it's worth now |
| 26 Sep 2025 | £169,950 |
| 19 Dec 2016 | £138,995 |
No other historical records.
Source Acknowledgement: © Crown copyright. England and Wales house price data is publicly available information produced by the HM Land Registry.This material was last updated on 4 February 2026. It covers the period from 1 January 1995 to 24 December 2025 and contains property transactions which have been registered during that period. Contains HM Land Registry data © Crown copyright and database right 2026. This data is licensed under the Open Government Licence v3.0.
Disclaimer: Rightmove.co.uk provides this HM Land Registry data "as is". The burden for fitness of the data relies completely with the user and is provided for informational purposes only. No warranty, express or implied, is given relating to the accuracy of content of the HM Land Registry data and Rightmove does not accept any liability for error or omission. If you have found an error with the data or need further information please contact HM Land Registry.
Permitted Use: Viewers of this Information are granted permission to access this Crown copyright material and to download it onto electronic, magnetic, optical or similar storage media provided that such activities are for private research, study or in-house use only. Any other use of the material requires the formal written permission of Land Registry which can be requested from us, and is subject to an additional licence and associated charge.
Map data ©OpenStreetMap contributors.
Rightmove takes no liability for your use of, or reliance on, Rightmove's Instant Valuation due to the limitations of our tracking tool listed here. Use of this tool is taken entirely at your own risk. All rights reserved.