
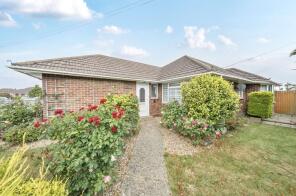
House Prices in Elmer Beach
House prices in Elmer Beach have an overall average of £361,468 over the last year.
The majority of properties sold in Elmer Beach during the last year were detached properties, selling for an average price of £450,450. Semi-detached properties sold for an average of £342,821, with flats fetching £160,312.
Overall, the historical sold prices in Elmer Beach over the last year were 3% down on the previous year and 4% up on the 2021 peak of £347,672.
Properties Sold
11, Virginia Gardens, Bognor Regis PO22 6BE

| Today | See what it's worth now |
| 2 Apr 2026 | £155,000 |
| 23 Sep 2013 | £195,000 |
No other historical records.
107, Flansham Park, Bognor Regis PO22 6RD
| Today | See what it's worth now |
| 6 Mar 2026 | £450,000 |
| 11 Nov 1996 | £91,000 |
No other historical records.
20, Summerhill Drive, Bognor Regis PO22 6AL
| Today | See what it's worth now |
| 20 Feb 2026 | £437,500 |
| 3 Dec 2007 | £281,000 |
14, Farm Close, Elmer, Bognor Regis PO22 6JQ

| Today | See what it's worth now |
| 12 Feb 2026 | £500,000 |
| 16 Feb 2018 | £365,000 |
No other historical records.
5, Norfolk Way, Elmer, Bognor Regis PO22 6JG
| Today | See what it's worth now |
| 12 Feb 2026 | £540,000 |
| 21 Sep 2001 | £179,950 |
No other historical records.
5, Hardy Close, Felpham PO22 6QX
| Today | See what it's worth now |
| 2 Feb 2026 | £360,000 |
No other historical records.
11, Farm Close, Elmer, Middleton-on-sea PO22 6JQ
| Today | See what it's worth now |
| 26 Jan 2026 | £295,000 |
No other historical records.
14, Sussex Court, Manor Way, Elmer, Bognor Regis PO22 6LE

| Today | See what it's worth now |
| 16 Jan 2026 | £110,000 |
| 18 Jul 2003 | £79,000 |
15, Henfield Way, Felpham PO22 6QL
| Today | See what it's worth now |
| 9 Jan 2026 | £202,000 |
No other historical records.
18, Montgomery Drive, Bognor Regis PO22 6RG
| Today | See what it's worth now |
| 5 Jan 2026 | £270,000 |
| 17 Nov 2006 | £191,000 |
6, Hardy Close, Bognor Regis PO22 6QX
| Today | See what it's worth now |
| 5 Jan 2026 | £360,000 |
| 21 Mar 2013 | £215,000 |
No other historical records.
26, Lucking Lane, Middleton-on-sea PO22 6HP
| Today | See what it's worth now |
| 19 Dec 2025 | £260,000 |
No other historical records.
31, Alfriston Close, Bognor Regis PO22 6QB
| Today | See what it's worth now |
| 18 Dec 2025 | £350,000 |
| 28 Sep 2021 | £267,000 |
30, Norfolk Way, Elmer, Bognor Regis PO22 6JF
| Today | See what it's worth now |
| 15 Dec 2025 | £425,000 |
| 16 Jan 2018 | £290,000 |
No other historical records.
2, Willow Brook, Bognor Regis PO22 6PD
| Today | See what it's worth now |
| 15 Dec 2025 | £325,000 |
| 18 Oct 1999 | £89,950 |
No other historical records.
26, Homefield Avenue, Bognor Regis PO22 6AN
| Today | See what it's worth now |
| 12 Dec 2025 | £310,000 |
| 25 Nov 2003 | £207,500 |
No other historical records.
6, Norfolk Way, Elmer, Bognor Regis PO22 6JF
| Today | See what it's worth now |
| 12 Dec 2025 | £590,000 |
| 25 Nov 2016 | £485,000 |
3, Alfriston Close, Bognor Regis PO22 6QB
| Today | See what it's worth now |
| 10 Dec 2025 | £361,300 |
| 19 Dec 2017 | £290,000 |
10, Findon Drive, Bognor Regis PO22 6QJ
| Today | See what it's worth now |
| 10 Dec 2025 | £284,000 |
| 5 Jan 2000 | £77,000 |
No other historical records.
4, Hadley Close, Bognor Regis PO22 6PG

| Today | See what it's worth now |
| 5 Dec 2025 | £462,500 |
| 18 Aug 2003 | £274,950 |
No other historical records.
2, Lane End Road, Bognor Regis PO22 6LL
| Today | See what it's worth now |
| 26 Nov 2025 | £387,500 |
| 3 Apr 2019 | £330,000 |
2a, Tuscan Avenue, Bognor Regis PO22 7TD
| Today | See what it's worth now |
| 13 Nov 2025 | £445,000 |
| 18 Dec 2009 | £242,000 |
64, Elmer Road, Bognor Regis PO22 6EU
| Today | See what it's worth now |
| 13 Nov 2025 | £385,000 |
| 20 Jun 2006 | £242,000 |
No other historical records.
Source Acknowledgement: © Crown copyright. England and Wales house price data is publicly available information produced by the HM Land Registry.This material was last updated on 9 July 2026. It covers the period from 1 January 1995 to 30 April 2026 and contains property transactions which have been registered during that period. Contains HM Land Registry data © Crown copyright and database right 2026. This data is licensed under the Open Government Licence v3.0.
Disclaimer: Rightmove.co.uk provides this HM Land Registry data "as is". The burden for fitness of the data relies completely with the user and is provided for informational purposes only. No warranty, express or implied, is given relating to the accuracy of content of the HM Land Registry data and Rightmove does not accept any liability for error or omission. If you have found an error with the data or need further information please contact HM Land Registry.
Permitted Use: Viewers of this Information are granted permission to access this Crown copyright material and to download it onto electronic, magnetic, optical or similar storage media provided that such activities are for private research, study or in-house use only. Any other use of the material requires the formal written permission of Land Registry which can be requested from us, and is subject to an additional licence and associated charge.
Rightmove takes no liability for your use of, or reliance on, Rightmove's Instant Valuation due to the limitations of our tracking tool listed here. Use of this tool is taken entirely at your own risk. All rights reserved.