
House Prices in Everton
House prices in Everton have an overall average of £520,790 over the last year.
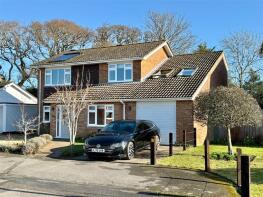
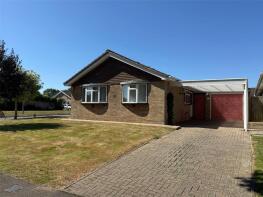
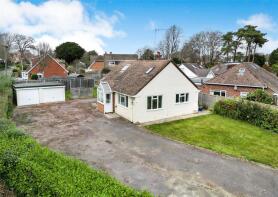
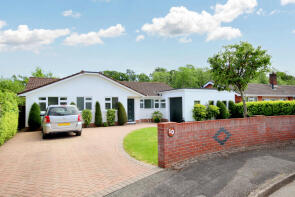
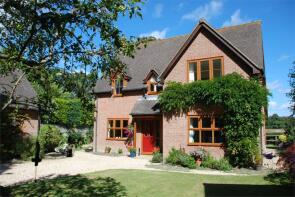
The majority of properties sold in Everton during the last year were detached properties, selling for an average price of £572,353. Semi-detached properties sold for an average of £417,158, with terraced properties fetching £266,000.
Overall, the historical sold prices in Everton over the last year were 12% up on the previous year and 17% down on the 2023 peak of £624,089.
Properties Sold
The Laurels, West Lane, Lymington SO41 0JQ
| Today | See what it's worth now |
| 12 Mar 2026 | £570,000 |
| 11 Mar 2016 | £460,000 |
2, Roberts Close, Lymington SO41 0ZE
| Today | See what it's worth now |
| 22 Jan 2026 | £615,000 |
| 24 May 1996 | £135,000 |
No other historical records.
White Shires, East Lane, Lymington SO41 0JL
| Today | See what it's worth now |
| 19 Dec 2025 | £955,000 |
| 17 Mar 2022 | £725,000 |
No other historical records.
5, Branwood Close, Lymington SO41 0LU
| Today | See what it's worth now |
| 16 Dec 2025 | £610,000 |
| 2 Dec 2005 | £310,000 |
No other historical records.
4, Fox Field, Lymington SO41 0LR
| Today | See what it's worth now |
| 12 Dec 2025 | £565,000 |
| 9 Aug 2017 | £465,000 |
22, Grange Close, Lymington SO41 0TY

| Today | See what it's worth now |
| 10 Dec 2025 | £455,000 |
| 28 Oct 2021 | £458,500 |
5, Oak Gardens, Everton SO41 0ZF
| Today | See what it's worth now |
| 28 Nov 2025 | £385,000 |
No other historical records.
1, Branwood Close, Lymington SO41 0LU
| Today | See what it's worth now |
| 20 Nov 2025 | £650,000 |
| 16 May 2014 | £400,000 |
No other historical records.
1, Cedar Drive, Lymington SO41 0ZB

| Today | See what it's worth now |
| 24 Oct 2025 | £399,950 |
| 5 May 2000 | £127,950 |
No other historical records.
9, Cherry Tree Close, Lymington SO41 0ZG
| Today | See what it's worth now |
| 24 Oct 2025 | £365,000 |
| 21 Feb 2020 | £285,000 |
38, Rodbourne Close, Lymington SO41 0LW
| Today | See what it's worth now |
| 24 Oct 2025 | £338,000 |
| 25 Jul 2023 | £350,000 |
14, Buckstone Close, Lymington SO41 0UE
| Today | See what it's worth now |
| 24 Oct 2025 | £455,000 |
| 18 Sep 2002 | £227,000 |
No other historical records.
66, Wainsford Road, Everton SO41 0UD
| Today | See what it's worth now |
| 24 Oct 2025 | £459,000 |
No other historical records.
15, Cedar Drive, Lymington SO41 0ZB
| Today | See what it's worth now |
| 30 Sep 2025 | £266,000 |
| 10 Jun 2016 | £195,000 |
314, Everton Road, Lymington SO41 0JX
| Today | See what it's worth now |
| 24 Sep 2025 | £458,000 |
| 16 Oct 2006 | £340,000 |
7, Beacon Close, Lymington SO41 0LQ
| Today | See what it's worth now |
| 17 Sep 2025 | £585,000 |
| 1 Feb 2010 | £312,000 |
6, Frys Lane, Everton SO41 0JY
| Today | See what it's worth now |
| 28 Aug 2025 | £425,000 |
No other historical records.
1, Plantation, Lymington SO41 0JU
| Today | See what it's worth now |
| 22 Aug 2025 | £435,000 |
| 27 Feb 1995 | £78,000 |
No other historical records.
10, Firmount Close, Lymington SO41 0JN
| Today | See what it's worth now |
| 14 Aug 2025 | £675,000 |
| 10 Oct 2014 | £397,000 |
Meadow Cottage, East Lane, Lymington SO41 0JL
| Today | See what it's worth now |
| 14 Aug 2025 | £900,000 |
| 7 Sep 2017 | £752,000 |
7, Rodbourne Close, Lymington SO41 0LW
| Today | See what it's worth now |
| 25 Jul 2025 | £330,000 |
| 4 Mar 2022 | £330,000 |
11, Yeovilton Close, Everton SO41 0JS
| Today | See what it's worth now |
| 17 Jul 2025 | £338,000 |
No other historical records.
3, Beacon Close, Lymington SO41 0LQ
| Today | See what it's worth now |
| 4 Jul 2025 | £465,000 |
| 16 Mar 2021 | £425,000 |
Source Acknowledgement: © Crown copyright. England and Wales house price data is publicly available information produced by the HM Land Registry.This material was last updated on 9 July 2026. It covers the period from 1 January 1995 to 30 April 2026 and contains property transactions which have been registered during that period. Contains HM Land Registry data © Crown copyright and database right 2026. This data is licensed under the Open Government Licence v3.0.
Disclaimer: Rightmove.co.uk provides this HM Land Registry data "as is". The burden for fitness of the data relies completely with the user and is provided for informational purposes only. No warranty, express or implied, is given relating to the accuracy of content of the HM Land Registry data and Rightmove does not accept any liability for error or omission. If you have found an error with the data or need further information please contact HM Land Registry.
Permitted Use: Viewers of this Information are granted permission to access this Crown copyright material and to download it onto electronic, magnetic, optical or similar storage media provided that such activities are for private research, study or in-house use only. Any other use of the material requires the formal written permission of Land Registry which can be requested from us, and is subject to an additional licence and associated charge.
Rightmove takes no liability for your use of, or reliance on, Rightmove's Instant Valuation due to the limitations of our tracking tool listed here. Use of this tool is taken entirely at your own risk. All rights reserved.