
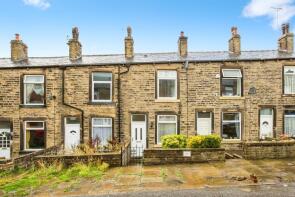
House Prices in Exley
House prices in Exley have an overall average of £187,359 over the last year.
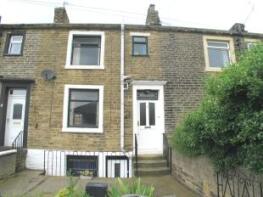
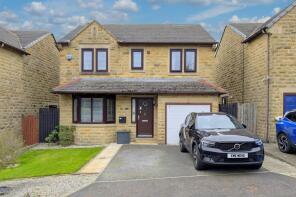
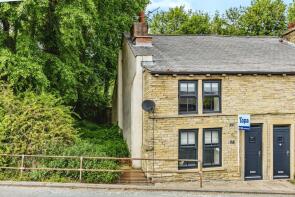
The majority of properties sold in Exley during the last year were terraced properties, selling for an average price of £156,929. Semi-detached properties sold for an average of £206,886, with detached properties fetching £452,000.
Overall, the historical sold prices in Exley over the last year were 5% up on the previous year and 14% up on the 2022 peak of £164,139.
Properties Sold
211, Backhold Drive, Siddal, Halifax HX3 9EB
| Today | See what it's worth now |
| 2 Apr 2026 | £125,000 |
| 25 Feb 1998 | £13,500 |
No other historical records.
13, Rustic Avenue, Southowram, Halifax HX3 9QW
| Today | See what it's worth now |
| 2 Apr 2026 | £230,000 |
| 15 Mar 2002 | £51,950 |
18, Albany Street, Halifax HX3 9JE
| Today | See what it's worth now |
| 1 Apr 2026 | £105,000 |
No other historical records.
2, Trooper Terrace, Halifax HX3 9JF
| Today | See what it's worth now |
| 31 Mar 2026 | £156,000 |
| 20 Mar 2020 | £120,000 |
47, Blaithroyd Lane, Southowram, Halifax HX3 9PS

| Today | See what it's worth now |
| 27 Mar 2026 | £198,000 |
| 21 Aug 2020 | £112,500 |
No other historical records.
13, Jubilee Road, Siddal, Halifax HX3 9LD
| Today | See what it's worth now |
| 27 Mar 2026 | £110,000 |
| 19 Jan 2007 | £78,000 |
11, Millside Way, Halifax HX3 9JU

| Today | See what it's worth now |
| 26 Mar 2026 | £550,000 |
| 20 Jun 2003 | £142,000 |
No other historical records.
5, Chapel Lane, Southowram, Halifax HX3 9TH
| Today | See what it's worth now |
| 26 Mar 2026 | £232,000 |
| 31 Mar 2016 | £138,000 |
20, Hadassah Street, Siddal, Halifax HX3 9AP
| Today | See what it's worth now |
| 6 Mar 2026 | £130,000 |
No other historical records.
8, Browning Heights, Browning Avenue, Siddal, Halifax HX3 9BB
| Today | See what it's worth now |
| 5 Mar 2026 | £48,000 |
| 17 Sep 2007 | £122,000 |
No other historical records.
3, Upper Marsh, Bank Top, Southowram, Halifax HX3 9PB
| Today | See what it's worth now |
| 27 Feb 2026 | £310,000 |
| 5 Dec 2003 | £166,500 |
No other historical records.
19, Bramble Close, Siddal, Halifax HX3 9EL
| Today | See what it's worth now |
| 20 Feb 2026 | £216,000 |
| 20 Dec 2013 | £113,000 |
19, Phoebe Lane, Halifax HX3 9AS
| Today | See what it's worth now |
| 20 Feb 2026 | £95,000 |
| 22 Apr 2008 | £70,000 |
4, Withinfield Court, Southowram, Halifax HX3 9UH
| Today | See what it's worth now |
| 20 Feb 2026 | £335,000 |
| 8 Sep 2014 | £177,500 |
10, Albany Street, Halifax HX3 9JE

| Today | See what it's worth now |
| 19 Feb 2026 | £92,500 |
| 30 Oct 2020 | £68,000 |
No other historical records.
1 Cain Cottages, 14, Cain Lane, Southowram, Brighouse HX3 9SB
| Today | See what it's worth now |
| 19 Feb 2026 | £255,000 |
| 12 Sep 2022 | £228,000 |
6, Park Lane, Siddal, Halifax HX3 9ED
| Today | See what it's worth now |
| 6 Feb 2026 | £200,000 |
| 1 Nov 2019 | £134,995 |
No other historical records.
1, Miners Way, Southowram, Halifax HX3 9QD
| Today | See what it's worth now |
| 6 Feb 2026 | £262,000 |
| 30 Apr 2010 | £149,000 |
No other historical records.
151, Jubilee Road, Siddal, Halifax HX3 9LL
| Today | See what it's worth now |
| 26 Jan 2026 | £182,000 |
| 15 Jun 2020 | £142,000 |
30, Exley Gardens, Halifax HX3 9EE
| Today | See what it's worth now |
| 23 Jan 2026 | £215,000 |
| 25 Apr 1995 | £29,000 |
No other historical records.
39, Backhold Avenue, Siddal, Halifax HX3 9DY
| Today | See what it's worth now |
| 16 Jan 2026 | £122,500 |
| 28 Nov 2003 | £25,000 |
No other historical records.
15, Siddal Grove, Halifax HX3 9AQ
| Today | See what it's worth now |
| 15 Jan 2026 | £133,000 |
| 26 Oct 2022 | £122,000 |
91, Keswick Close, Siddal, Halifax HX3 9BP
| Today | See what it's worth now |
| 12 Jan 2026 | £170,000 |
| 5 Jul 2013 | £91,500 |
Source Acknowledgement: © Crown copyright. England and Wales house price data is publicly available information produced by the HM Land Registry.This material was last updated on 9 July 2026. It covers the period from 1 January 1995 to 30 April 2026 and contains property transactions which have been registered during that period. Contains HM Land Registry data © Crown copyright and database right 2026. This data is licensed under the Open Government Licence v3.0.
Disclaimer: Rightmove.co.uk provides this HM Land Registry data "as is". The burden for fitness of the data relies completely with the user and is provided for informational purposes only. No warranty, express or implied, is given relating to the accuracy of content of the HM Land Registry data and Rightmove does not accept any liability for error or omission. If you have found an error with the data or need further information please contact HM Land Registry.
Permitted Use: Viewers of this Information are granted permission to access this Crown copyright material and to download it onto electronic, magnetic, optical or similar storage media provided that such activities are for private research, study or in-house use only. Any other use of the material requires the formal written permission of Land Registry which can be requested from us, and is subject to an additional licence and associated charge.
Rightmove takes no liability for your use of, or reliance on, Rightmove's Instant Valuation due to the limitations of our tracking tool listed here. Use of this tool is taken entirely at your own risk. All rights reserved.