
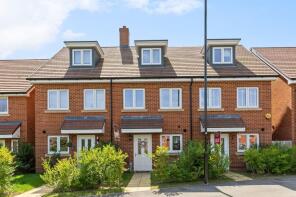
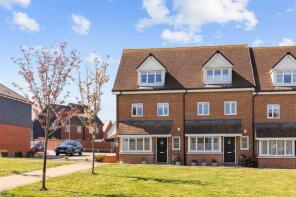
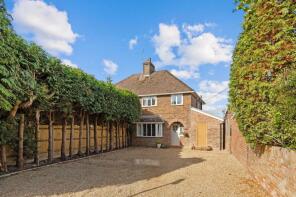
House Prices in Faygate
House prices in Faygate have an overall average of £388,999 over the last year.
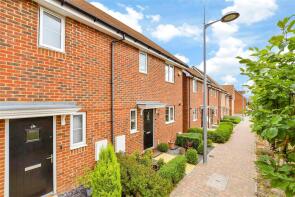
The majority of properties sold in Faygate during the last year were semi-detached properties, selling for an average price of £434,437. Flats sold for an average of £268,929, with terraced properties fetching £453,656.
Overall, the historical sold prices in Faygate over the last year were 6% down on the previous year and 22% down on the 2001 peak of £497,471.
Properties Sold
7, Harrys Way, Faygate RH12 0DT
| Today | See what it's worth now |
| 31 Mar 2026 | £391,250 |
| 1 Dec 2023 | £399,950 |
No other historical records.
37, Stillwell Way, Horsham RH12 0BS
| Today | See what it's worth now |
| 27 Mar 2026 | £545,000 |
| 25 Mar 2022 | £515,950 |
No other historical records.
5, Ely Way, Horsham RH12 0DJ

| Today | See what it's worth now |
| 17 Mar 2026 | £375,000 |
| 10 Oct 2022 | £362,450 |
No other historical records.
6, Beeches Way, Horsham RH12 0AD
| Today | See what it's worth now |
| 13 Mar 2026 | £460,000 |
| 20 Dec 2018 | £372,000 |
No other historical records.
70, Illett Way, Horsham RH12 0AJ

| Today | See what it's worth now |
| 13 Mar 2026 | £250,000 |
| 11 Jun 2021 | £269,950 |
No other historical records.
68, Beeches Way, Horsham RH12 0AD

| Today | See what it's worth now |
| 12 Mar 2026 | £450,000 |
| 14 Aug 2015 | £362,950 |
No other historical records.
20, Halls Drive, Horsham RH12 4QN
| Today | See what it's worth now |
| 3 Mar 2026 | £475,000 |
| 19 Feb 2021 | £440,000 |
91, Illett Way, Horsham RH12 0AJ
| Today | See what it's worth now |
| 20 Feb 2026 | £400,000 |
| 19 Mar 2021 | £385,000 |
No other historical records.
7, Carylls Cottages, Faygate Lane, Horsham RH12 4SQ
| Today | See what it's worth now |
| 18 Feb 2026 | £345,000 |
| 11 Aug 1995 | £66,100 |
No other historical records.
78, Beeches Way, Horsham RH12 0AD
| Today | See what it's worth now |
| 16 Feb 2026 | £535,000 |
| 14 Sep 2015 | £435,950 |
No other historical records.
6, Rose Cottages, Clovers Way, Horsham RH12 4WB

| Today | See what it's worth now |
| 16 Feb 2026 | £405,000 |
| 16 Apr 2004 | £236,000 |
1, Calico Street, Horsham RH12 0BG
| Today | See what it's worth now |
| 16 Feb 2026 | £377,500 |
| 27 Nov 2018 | £340,000 |
No other historical records.
20, Capon Park, Horsham RH12 0DE
| Today | See what it's worth now |
| 10 Feb 2026 | £465,000 |
| 30 Sep 2020 | £400,000 |
No other historical records.
11, Beeches Way, Horsham RH12 0AB
| Today | See what it's worth now |
| 8 Jan 2026 | £515,000 |
| 30 Sep 2014 | £404,950 |
No other historical records.
11, Illett Way, Horsham RH12 0AJ
| Today | See what it's worth now |
| 8 Jan 2026 | £277,500 |
| 25 Nov 2016 | £257,000 |
1, High Beeches, Horsham RH12 0BH
| Today | See what it's worth now |
| 19 Dec 2025 | £460,000 |
| 30 Apr 2024 | £430,000 |
79, Clay Vale, Horsham RH12 0AU
| Today | See what it's worth now |
| 19 Dec 2025 | £270,000 |
| 10 Dec 2020 | £269,950 |
No other historical records.
9, Poplar Court, Horsham RH12 4AF

| Today | See what it's worth now |
| 17 Dec 2025 | £650,000 |
| 18 Apr 2016 | £585,000 |
No other historical records.
1, Wellers Cottages, Faygate Lane, Horsham RH12 4SH
| Today | See what it's worth now |
| 12 Dec 2025 | £442,000 |
| 25 May 2021 | £250,000 |
No other historical records.
8, Mole Crescent, Horsham RH12 0AT
| Today | See what it's worth now |
| 8 Dec 2025 | £442,500 |
| 31 Oct 2017 | £414,950 |
No other historical records.
7, Bricklayer Lane, Horsham RH12 0AA
| Today | See what it's worth now |
| 8 Dec 2025 | £425,000 |
| 23 Feb 2017 | £419,950 |
No other historical records.
6, Brickyard Way, Horsham RH12 0AE
| Today | See what it's worth now |
| 3 Dec 2025 | £447,400 |
| 21 Dec 2015 | £399,950 |
No other historical records.
65, Clay Vale, Horsham RH12 0AU
| Today | See what it's worth now |
| 1 Dec 2025 | £295,000 |
| 14 Jul 2021 | £284,950 |
No other historical records.

Source Acknowledgement: © Crown copyright. England and Wales house price data is publicly available information produced by the HM Land Registry.This material was last updated on 9 July 2026. It covers the period from 1 January 1995 to 30 April 2026 and contains property transactions which have been registered during that period. Contains HM Land Registry data © Crown copyright and database right 2026. This data is licensed under the Open Government Licence v3.0.
Disclaimer: Rightmove.co.uk provides this HM Land Registry data "as is". The burden for fitness of the data relies completely with the user and is provided for informational purposes only. No warranty, express or implied, is given relating to the accuracy of content of the HM Land Registry data and Rightmove does not accept any liability for error or omission. If you have found an error with the data or need further information please contact HM Land Registry.
Permitted Use: Viewers of this Information are granted permission to access this Crown copyright material and to download it onto electronic, magnetic, optical or similar storage media provided that such activities are for private research, study or in-house use only. Any other use of the material requires the formal written permission of Land Registry which can be requested from us, and is subject to an additional licence and associated charge.
Rightmove takes no liability for your use of, or reliance on, Rightmove's Instant Valuation due to the limitations of our tracking tool listed here. Use of this tool is taken entirely at your own risk. All rights reserved.