
House Prices in Felling
House prices in Felling have an overall average of £154,216 over the last year.
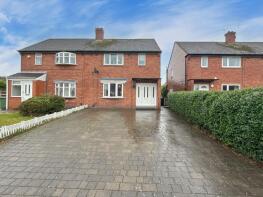
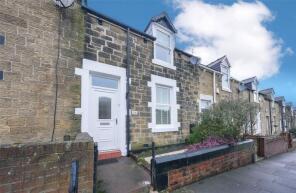
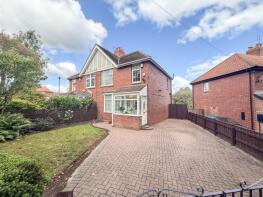
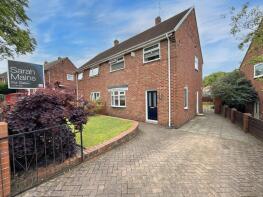
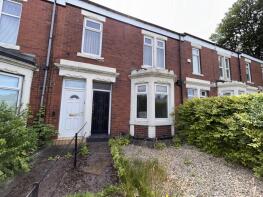
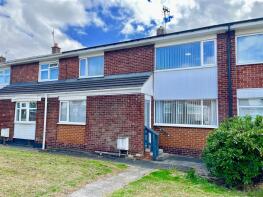
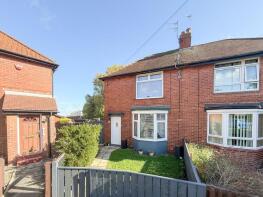
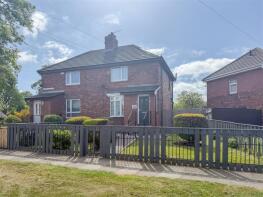
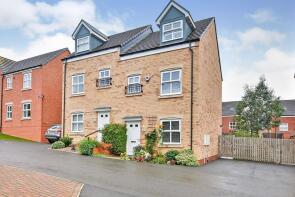
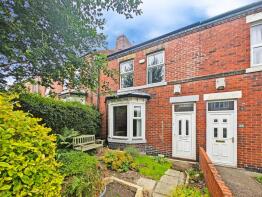
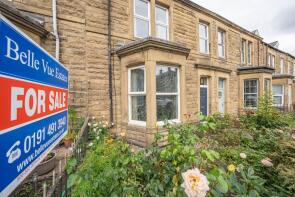
The majority of properties sold in Felling during the last year were semi-detached properties, selling for an average price of £155,241. Terraced properties sold for an average of £149,921, with flats fetching £94,700.
Overall, the historical sold prices in Felling over the last year were 20% up on the previous year and 21% up on the 2022 peak of £127,920.
Properties Sold
41, Ell Dene Crescent, Bog House Estate, Gateshead NE10 9UN
| Today | See what it's worth now |
| 10 Apr 2026 | £175,000 |
| 10 Aug 2007 | £136,000 |
No other historical records.
6, Kensington Court, Felling Central, Gateshead NE10 9UD
| Today | See what it's worth now |
| 7 Apr 2026 | £78,000 |
| 5 Sep 2003 | £65,500 |
25, Sandringham Court, Felling Central, Gateshead NE10 9UB
| Today | See what it's worth now |
| 2 Apr 2026 | £77,000 |
| 29 Jul 2022 | £76,500 |
10, Monksfeld, Bog House Estate, Gateshead NE10 9UP
| Today | See what it's worth now |
| 31 Mar 2026 | £182,000 |
| 9 Sep 2021 | £122,500 |
No other historical records.
13, Fleming Gardens, Bog House Estate, Gateshead NE10 9DJ
| Today | See what it's worth now |
| 27 Mar 2026 | £129,000 |
| 12 Jan 2017 | £93,600 |
16, The Bungalows, Sunderland Road, Gateshead NE10 0NU
| Today | See what it's worth now |
| 9 Mar 2026 | £157,500 |
| 7 Jul 2015 | £89,000 |
24, Cooperative Terrace, Felling Central, Gateshead NE10 9BT
| Today | See what it's worth now |
| 27 Feb 2026 | £135,000 |
| 28 Jun 2019 | £105,000 |
66, Chilside Road, Bog House Estate, Gateshead NE10 9EA
| Today | See what it's worth now |
| 27 Feb 2026 | £153,000 |
| 18 Nov 2010 | £106,000 |
171, St Cuthberts Drive, Heworth, Gateshead NE10 9AD
| Today | See what it's worth now |
| 19 Feb 2026 | £166,000 |
| 13 Dec 2018 | £105,000 |
No other historical records.
3, Stowell Terrace, Heworth, Gateshead NE10 0NX
| Today | See what it's worth now |
| 19 Feb 2026 | £82,000 |
| 15 Oct 2010 | £84,000 |
1, Thornygarth, Bog House Estate, Gateshead NE10 9UU

| Today | See what it's worth now |
| 19 Feb 2026 | £173,000 |
| 10 Nov 2017 | £110,000 |
No other historical records.
18, Millbrook, High Heworth, Gateshead NE10 9XN
| Today | See what it's worth now |
| 13 Feb 2026 | £146,000 |
| 28 Jan 2022 | £100,000 |
No other historical records.
12, Picherwell, Bog House Estate, Gateshead NE10 9EB
| Today | See what it's worth now |
| 12 Feb 2026 | £130,000 |
| 12 Feb 2014 | £78,000 |
3, St James Court, Felling Central, Felling NE10 0AW

| Today | See what it's worth now |
| 30 Jan 2026 | £110,000 |
No other historical records.
3, Hopper Road, Felling Central, Gateshead NE10 9TJ
| Today | See what it's worth now |
| 30 Jan 2026 | £110,000 |
| 3 Sep 2021 | £117,000 |
No other historical records.
10, Sheriffs Close, Felling Central, Gateshead NE10 9TW
| Today | See what it's worth now |
| 30 Jan 2026 | £150,000 |
| 29 Feb 2008 | £120,000 |
20, Fleetwood Way, Sunderland Road, Gateshead NE8 3FD
| Today | See what it's worth now |
| 14 Jan 2026 | £178,000 |
| 21 Mar 2018 | £163,000 |
10, Ell Dene Crescent, Bog House Estate, Felling NE10 9UN
| Today | See what it's worth now |
| 6 Jan 2026 | £115,000 |
No other historical records.
22, Kings Close, Sunderland Road, Gateshead NE8 3PW
| Today | See what it's worth now |
| 19 Dec 2025 | £102,000 |
| 26 Jul 2019 | £67,500 |
No other historical records.
25, St Johns Place, Felling Central, Gateshead NE10 9DF
| Today | See what it's worth now |
| 19 Dec 2025 | £80,000 |
| 30 Jul 2018 | £89,500 |
28, Bishops Park Road, Sunderland Road, Gateshead NE8 3FF
| Today | See what it's worth now |
| 17 Dec 2025 | £165,000 |
| 17 Dec 2025 | £165,000 |
13, The Avenue, Felling Central, Gateshead NE10 0JA
| Today | See what it's worth now |
| 16 Dec 2025 | £125,000 |
| 25 Apr 2014 | £97,000 |
9, Ellerton Way, Felling Central, Gateshead NE10 9TF

| Today | See what it's worth now |
| 15 Dec 2025 | £160,000 |
| 7 Aug 2020 | £128,000 |
Source Acknowledgement: © Crown copyright. England and Wales house price data is publicly available information produced by the HM Land Registry.This material was last updated on 9 July 2026. It covers the period from 1 January 1995 to 30 April 2026 and contains property transactions which have been registered during that period. Contains HM Land Registry data © Crown copyright and database right 2026. This data is licensed under the Open Government Licence v3.0.
Disclaimer: Rightmove.co.uk provides this HM Land Registry data "as is". The burden for fitness of the data relies completely with the user and is provided for informational purposes only. No warranty, express or implied, is given relating to the accuracy of content of the HM Land Registry data and Rightmove does not accept any liability for error or omission. If you have found an error with the data or need further information please contact HM Land Registry.
Permitted Use: Viewers of this Information are granted permission to access this Crown copyright material and to download it onto electronic, magnetic, optical or similar storage media provided that such activities are for private research, study or in-house use only. Any other use of the material requires the formal written permission of Land Registry which can be requested from us, and is subject to an additional licence and associated charge.
Rightmove takes no liability for your use of, or reliance on, Rightmove's Instant Valuation due to the limitations of our tracking tool listed here. Use of this tool is taken entirely at your own risk. All rights reserved.