
House Prices in Feltham Hill
House prices in Feltham Hill have an overall average of £387,948 over the last year.
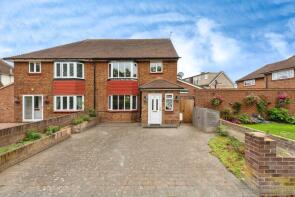
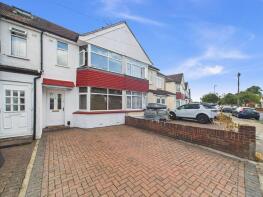
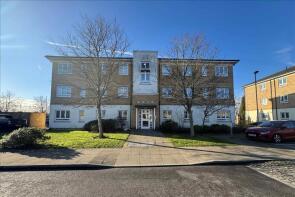
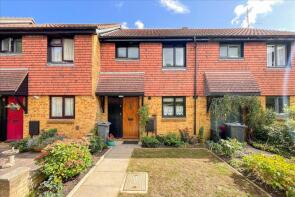
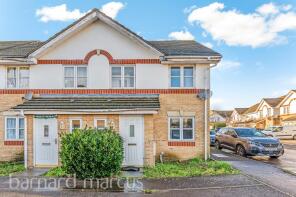
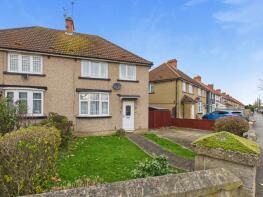
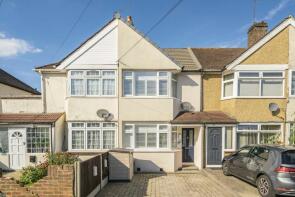
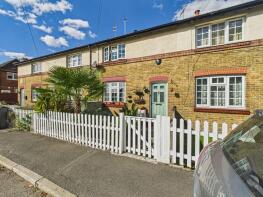
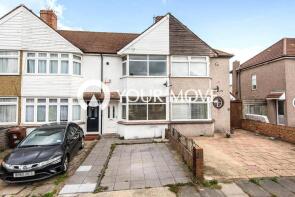
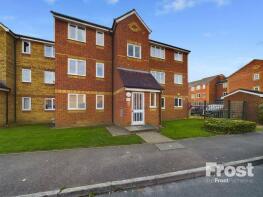
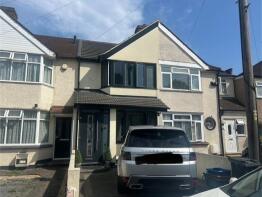
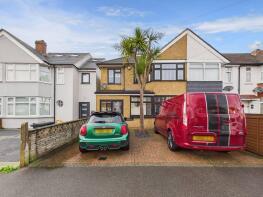
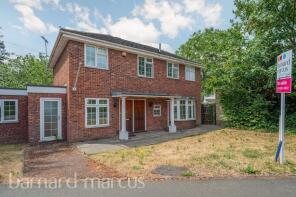
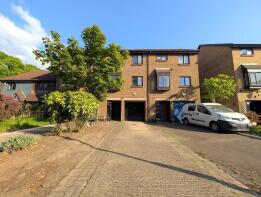
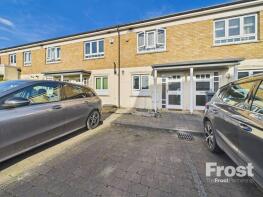
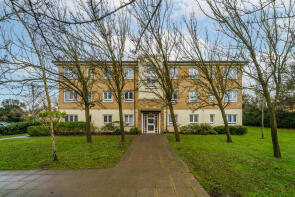
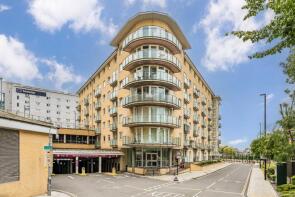
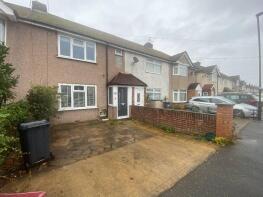
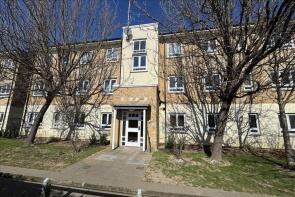
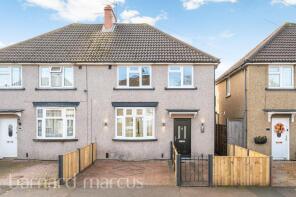
The majority of properties sold in Feltham Hill during the last year were terraced properties, selling for an average price of £454,620. Flats sold for an average of £210,276, with semi-detached properties fetching £459,889.
Overall, the historical sold prices in Feltham Hill over the last year were 6% up on the previous year and 3% up on the 2022 peak of £375,551.
Properties Sold
79, Chertsey Road, Feltham TW13 4RJ
| Today | See what it's worth now |
| 16 Apr 2026 | £555,000 |
| 17 Apr 2007 | £295,000 |
45, Rochester Avenue, Feltham TW13 4EA
| Today | See what it's worth now |
| 1 Apr 2026 | £520,000 |
| 20 Dec 2007 | £203,000 |
No other historical records.
Flat 116, Sienna Court, Elvedon Road, Feltham TW13 4SG
| Today | See what it's worth now |
| 27 Mar 2026 | £250,000 |
| 6 May 2003 | £177,000 |
No other historical records.
6, Brookside Close, Feltham TW13 7HR
| Today | See what it's worth now |
| 26 Mar 2026 | £438,000 |
No other historical records.
52, Highfield Road, Feltham TW13 4DZ
| Today | See what it's worth now |
| 16 Mar 2026 | £398,000 |
| 27 Apr 2001 | £144,995 |
No other historical records.
4, Raleigh Road, Feltham TW13 4LR
| Today | See what it's worth now |
| 12 Mar 2026 | £445,000 |
No other historical records.
38, Fernside Avenue, Feltham TW13 7BL
| Today | See what it's worth now |
| 10 Mar 2026 | £429,950 |
| 28 Jun 2021 | £390,950 |
25, Ordnance Close, Feltham TW13 7AU
| Today | See what it's worth now |
| 3 Mar 2026 | £495,000 |
| 29 Oct 2020 | £410,000 |
208, Elmwood Avenue, Feltham TW13 7QA

| Today | See what it's worth now |
| 2 Mar 2026 | £220,000 |
No other historical records.
58, Foxwood Close, Feltham TW13 7DL

| Today | See what it's worth now |
| 1 Mar 2026 | £440,000 |
| 25 Nov 2021 | £378,000 |
No other historical records.
32, Hanover Avenue, Feltham TW13 4JW
| Today | See what it's worth now |
| 27 Feb 2026 | £405,000 |
| 31 Jan 2014 | £239,950 |
129, Redford Close, Feltham TW13 4TE
| Today | See what it's worth now |
| 26 Feb 2026 | £145,000 |
| 20 Apr 2021 | £150,000 |
44, Southcote Avenue, Feltham TW13 4EG
| Today | See what it's worth now |
| 24 Feb 2026 | £435,000 |
No other historical records.
7, Pinkcoat Close, Feltham TW13 7HL

| Today | See what it's worth now |
| 23 Feb 2026 | £410,000 |
| 18 Oct 1996 | £66,500 |
No other historical records.
9, Cravan Avenue, Feltham TW13 4EE
| Today | See what it's worth now |
| 19 Feb 2026 | £585,000 |
| 17 Sep 1999 | £99,950 |
No other historical records.
7, Blakewood Close, Feltham TW13 7NL
| Today | See what it's worth now |
| 19 Feb 2026 | £715,000 |
No other historical records.
7, Roebuck Close, Feltham TW13 7DE
| Today | See what it's worth now |
| 19 Feb 2026 | £470,000 |
| 21 Jul 2014 | £299,950 |
No other historical records.
25, Elvedon Road, Feltham TW13 4RP
| Today | See what it's worth now |
| 13 Feb 2026 | £405,000 |
| 3 Oct 2003 | £195,000 |
No other historical records.
Flat 54, Azure Court, Elvedon Road, Feltham TW13 4RR
| Today | See what it's worth now |
| 13 Feb 2026 | £203,000 |
| 14 Mar 2008 | £178,000 |
485, Redford Close, Feltham TW13 4TP

| Today | See what it's worth now |
| 12 Feb 2026 | £427,500 |
| 21 Jun 2007 | £237,000 |
Flat 33, Bergenia House, Bedfont Lane, Feltham TW13 4GE
| Today | See what it's worth now |
| 12 Feb 2026 | £217,000 |
| 6 Aug 2020 | £215,000 |
No other historical records.
104, Hamilton Road, Feltham TW13 4PX
| Today | See what it's worth now |
| 11 Feb 2026 | £412,000 |
| 3 Oct 2014 | £250,000 |
No other historical records.
6, Viridian Court, Ashford Road, Feltham TW13 4SD
| Today | See what it's worth now |
| 10 Feb 2026 | £240,000 |
| 15 Sep 2003 | £182,000 |
No other historical records.
Source Acknowledgement: © Crown copyright. England and Wales house price data is publicly available information produced by the HM Land Registry.This material was last updated on 9 July 2026. It covers the period from 1 January 1995 to 30 April 2026 and contains property transactions which have been registered during that period. Contains HM Land Registry data © Crown copyright and database right 2026. This data is licensed under the Open Government Licence v3.0.
Disclaimer: Rightmove.co.uk provides this HM Land Registry data "as is". The burden for fitness of the data relies completely with the user and is provided for informational purposes only. No warranty, express or implied, is given relating to the accuracy of content of the HM Land Registry data and Rightmove does not accept any liability for error or omission. If you have found an error with the data or need further information please contact HM Land Registry.
Permitted Use: Viewers of this Information are granted permission to access this Crown copyright material and to download it onto electronic, magnetic, optical or similar storage media provided that such activities are for private research, study or in-house use only. Any other use of the material requires the formal written permission of Land Registry which can be requested from us, and is subject to an additional licence and associated charge.
Rightmove takes no liability for your use of, or reliance on, Rightmove's Instant Valuation due to the limitations of our tracking tool listed here. Use of this tool is taken entirely at your own risk. All rights reserved.