
House Prices in Fernhurst
House prices in Fernhurst have an overall average of £969,214 over the last year.
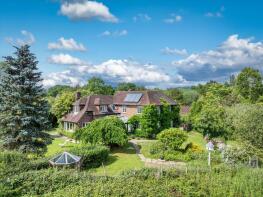
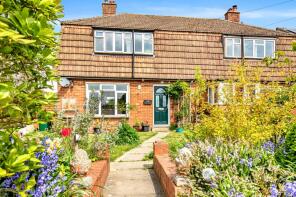
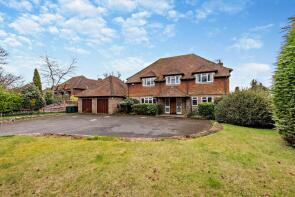
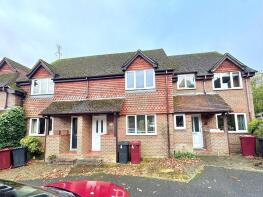
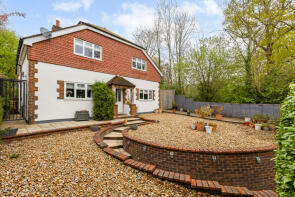
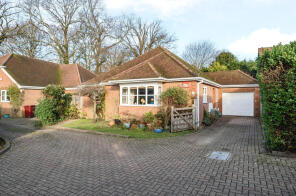
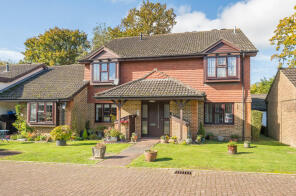
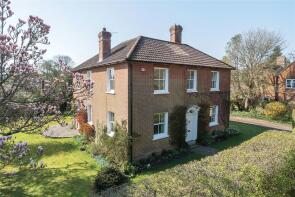
The majority of properties sold in Fernhurst during the last year were detached properties, selling for an average price of £1,411,000. Semi-detached properties sold for an average of £831,000, with terraced properties fetching £295,625.
Overall, the historical sold prices in Fernhurst over the last year were 64% up on the previous year and 22% up on the 2023 peak of £795,081.
Properties Sold
57, Nappers Wood, Haslemere GU27 3PE

| Today | See what it's worth now |
| 25 Mar 2026 | £486,000 |
| 7 Jun 2021 | £320,000 |
No other historical records.
Highlands, Fridays Hill, Haslemere GU27 3DX

| Today | See what it's worth now |
| 29 Jan 2026 | £2,850,000 |
| 28 Jun 2011 | £525,000 |
No other historical records.
5, The Marches, Haslemere GU27 3DT
| Today | See what it's worth now |
| 5 Dec 2025 | £1,000,000 |
| 5 Apr 2019 | £590,000 |
Ropes, Ropes Lane, Haslemere GU27 3JD
| Today | See what it's worth now |
| 20 Nov 2025 | £2,175,000 |
No other historical records.
27, West Close, Haslemere GU27 3JR
| Today | See what it's worth now |
| 14 Nov 2025 | £585,000 |
| 1 Apr 2016 | £465,000 |
3, Vann Bridge Close, Haslemere GU27 3NA
| Today | See what it's worth now |
| 6 Nov 2025 | £390,000 |
| 14 Dec 2018 | £327,000 |
Hawkswood, Hawksfold Lane East, Haslemere GU27 3JW

| Today | See what it's worth now |
| 31 Oct 2025 | £1,150,000 |
| 30 Jul 1999 | £315,000 |
No other historical records.
11, The Leys, Haslemere GU27 3JY
| Today | See what it's worth now |
| 31 Oct 2025 | £555,000 |
| 12 Jun 2009 | £310,000 |
No other historical records.
Mayfield, Midhurst Road, Haslemere GU27 3EZ
| Today | See what it's worth now |
| 31 Oct 2025 | £1,100,000 |
| 17 Jun 1998 | £332,500 |
60, Nappers Wood, Haslemere GU27 3PE
| Today | See what it's worth now |
| 8 Oct 2025 | £400,000 |
| 30 Sep 2016 | £315,000 |
No other historical records.
Broadoak, Hawksfold Lane West, Fernhurst GU27 3JW
| Today | See what it's worth now |
| 30 Sep 2025 | £1,255,000 |
No other historical records.
4, Tavern Court, Haslemere GU27 3NN
| Today | See what it's worth now |
| 30 Sep 2025 | £315,000 |
| 24 Sep 2004 | £175,000 |
No other historical records.
87 Thrush Cottage, Midhurst Road, Haslemere GU27 3EU
| Today | See what it's worth now |
| 10 Sep 2025 | £605,000 |
| 4 Aug 2016 | £340,000 |
No other historical records.
11 Orchard Way, Church Road, Haslemere GU27 3HZ
| Today | See what it's worth now |
| 26 Aug 2025 | £965,000 |
| 27 Nov 2017 | £580,000 |
2, Cherrylands Close, Haslemere GU27 3PH
| Today | See what it's worth now |
| 22 Aug 2025 | £535,000 |
| 17 Apr 2014 | £315,000 |
4, Hawksfold House, Hawksfold Lane East, Fernhurst GU27 3JW
| Today | See what it's worth now |
| 15 Aug 2025 | £355,000 |
No other historical records.
18, Ash Grove, Haslemere GU27 3HL
| Today | See what it's worth now |
| 8 Aug 2025 | £75,000 |
| 6 Jul 2012 | £134,000 |
8, Church Road, Fernhurst GU27 3HZ
| Today | See what it's worth now |
| 24 Jul 2025 | £1,315,000 |
No other historical records.
Chase Farm, The Green, Fernhurst GU27 3HY
| Today | See what it's worth now |
| 24 Jul 2025 | £3,385,000 |
No other historical records.
5, Ash Grove, Haslemere GU27 3HL
| Today | See what it's worth now |
| 18 Jul 2025 | £122,500 |
| 20 Nov 2020 | £155,000 |
29, Old Glebe, Haslemere GU27 3HT
| Today | See what it's worth now |
| 10 Jul 2025 | £735,000 |
| 9 Dec 2019 | £535,000 |
23 The Orchard, Midhurst Road, Haslemere GU27 3EJ
| Today | See what it's worth now |
| 23 Jun 2025 | £950,000 |
No other historical records.
56, West Close, Haslemere GU27 3JT
| Today | See what it's worth now |
| 16 May 2025 | £485,000 |
| 17 Nov 2020 | £370,000 |
Source Acknowledgement: © Crown copyright. England and Wales house price data is publicly available information produced by the HM Land Registry.This material was last updated on 9 July 2026. It covers the period from 1 January 1995 to 30 April 2026 and contains property transactions which have been registered during that period. Contains HM Land Registry data © Crown copyright and database right 2026. This data is licensed under the Open Government Licence v3.0.
Disclaimer: Rightmove.co.uk provides this HM Land Registry data "as is". The burden for fitness of the data relies completely with the user and is provided for informational purposes only. No warranty, express or implied, is given relating to the accuracy of content of the HM Land Registry data and Rightmove does not accept any liability for error or omission. If you have found an error with the data or need further information please contact HM Land Registry.
Permitted Use: Viewers of this Information are granted permission to access this Crown copyright material and to download it onto electronic, magnetic, optical or similar storage media provided that such activities are for private research, study or in-house use only. Any other use of the material requires the formal written permission of Land Registry which can be requested from us, and is subject to an additional licence and associated charge.
Rightmove takes no liability for your use of, or reliance on, Rightmove's Instant Valuation due to the limitations of our tracking tool listed here. Use of this tool is taken entirely at your own risk. All rights reserved.