
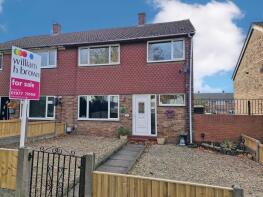
House Prices in Ferrybridge
House prices in Ferrybridge have an overall average of £182,829 over the last year.
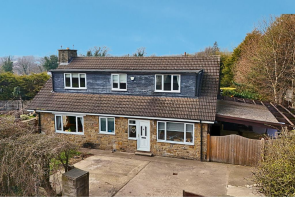
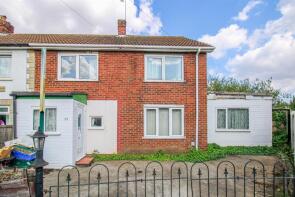
The majority of properties sold in Ferrybridge during the last year were semi-detached properties, selling for an average price of £173,882. Terraced properties sold for an average of £146,923, with detached properties fetching £306,600.
Overall, the historical sold prices in Ferrybridge over the last year were 12% up on the previous year and 55% down on the 2023 peak of £403,143.
Properties Sold
127, Pollards Fields, Knottingley WF11 8TB

| Today | See what it's worth now |
| 7 Apr 2026 | £160,000 |
| 6 May 2022 | £120,000 |
17, Vale Avenue, Knottingley WF11 8JH
| Today | See what it's worth now |
| 27 Mar 2026 | £183,500 |
| 25 Jan 2021 | £125,000 |
7, Vale Walk, Knottingley WF11 8JW
| Today | See what it's worth now |
| 25 Mar 2026 | £179,000 |
| 27 Mar 2015 | £75,500 |
No other historical records.
22, Mill View, Knottingley WF11 8SR

| Today | See what it's worth now |
| 23 Feb 2026 | £175,000 |
| 21 Jul 2000 | £38,500 |
19, Balmoral Drive, Knottingley WF11 8RQ
| Today | See what it's worth now |
| 6 Feb 2026 | £179,000 |
No other historical records.
35, The Wharf, Knottingley WF11 8BT
| Today | See what it's worth now |
| 30 Jan 2026 | £155,000 |
| 30 Aug 2022 | £145,501 |
5, Tennyson Close, Knottingley WF11 8QJ
| Today | See what it's worth now |
| 27 Jan 2026 | £165,000 |
| 23 Mar 2020 | £65,000 |
No other historical records.
5, Pontefract Road, Knottingley WF11 8RW
| Today | See what it's worth now |
| 27 Jan 2026 | £350,000 |
| 23 Jul 2004 | £175,000 |
No other historical records.
17, Tenters Close, Knottingley WF11 8LU
| Today | See what it's worth now |
| 19 Jan 2026 | £100,000 |
| 20 Jan 2000 | £35,000 |
No other historical records.
16, Kingsley Avenue, Knottingley WF11 8PY
| Today | See what it's worth now |
| 19 Dec 2025 | £170,000 |
| 16 Jul 2004 | £85,775 |
No other historical records.
83, Pollards Fields, Knottingley WF11 8TB
| Today | See what it's worth now |
| 5 Dec 2025 | £115,000 |
| 30 May 2003 | £59,995 |
12, Ferrybridge Road, Knottingley WF11 8JF
| Today | See what it's worth now |
| 4 Dec 2025 | £560,000 |
| 15 Apr 2005 | £270,000 |
No other historical records.
13, Grange Close, Knottingley WF11 8LF
| Today | See what it's worth now |
| 1 Dec 2025 | £215,000 |
No other historical records.
Pottery House, Pottery Lane, Knottingley WF11 8JX
| Today | See what it's worth now |
| 28 Nov 2025 | £148,000 |
| 11 May 2018 | £135,000 |
No other historical records.
18, Vale Walk, Knottingley WF11 8JW
| Today | See what it's worth now |
| 27 Nov 2025 | £190,000 |
| 18 Jun 2021 | £133,000 |
6, Brotherton Court, Knottingley WF11 8BX
| Today | See what it's worth now |
| 20 Nov 2025 | £140,000 |
| 30 Jun 2010 | £114,995 |
No other historical records.
105, Arncliffe Drive, Knottingley WF11 8SS
| Today | See what it's worth now |
| 7 Nov 2025 | £195,000 |
| 24 Feb 2022 | £180,000 |
19, Arncliffe Drive, Knottingley WF11 8PU
| Today | See what it's worth now |
| 23 Oct 2025 | £180,000 |
| 7 Dec 2009 | £125,995 |
70, Pollards Fields, Knottingley WF11 8TD
| Today | See what it's worth now |
| 9 Oct 2025 | £120,000 |
| 29 Oct 2004 | £80,000 |
17, Snowdon Avenue, Knottingley WF11 8PE
| Today | See what it's worth now |
| 5 Sep 2025 | £260,000 |
| 31 Mar 2014 | £125,000 |
No other historical records.
78, Pontefract Road, Ferrybridge, Knottingley WF11 8PS

| Today | See what it's worth now |
| 20 Aug 2025 | £212,000 |
| 7 Mar 2014 | £125,000 |
No other historical records.
Wilspoon Cottage, The Square, Ferrybridge, Knottingley WF11 8ND
| Today | See what it's worth now |
| 15 Aug 2025 | £220,000 |
| 15 Feb 2022 | £245,000 |
83, Arncliffe Drive, Knottingley WF11 8SS
| Today | See what it's worth now |
| 8 Aug 2025 | £135,000 |
| 20 Oct 2017 | £84,000 |
Source Acknowledgement: © Crown copyright. England and Wales house price data is publicly available information produced by the HM Land Registry.This material was last updated on 9 July 2026. It covers the period from 1 January 1995 to 30 April 2026 and contains property transactions which have been registered during that period. Contains HM Land Registry data © Crown copyright and database right 2026. This data is licensed under the Open Government Licence v3.0.
Disclaimer: Rightmove.co.uk provides this HM Land Registry data "as is". The burden for fitness of the data relies completely with the user and is provided for informational purposes only. No warranty, express or implied, is given relating to the accuracy of content of the HM Land Registry data and Rightmove does not accept any liability for error or omission. If you have found an error with the data or need further information please contact HM Land Registry.
Permitted Use: Viewers of this Information are granted permission to access this Crown copyright material and to download it onto electronic, magnetic, optical or similar storage media provided that such activities are for private research, study or in-house use only. Any other use of the material requires the formal written permission of Land Registry which can be requested from us, and is subject to an additional licence and associated charge.
Rightmove takes no liability for your use of, or reliance on, Rightmove's Instant Valuation due to the limitations of our tracking tool listed here. Use of this tool is taken entirely at your own risk. All rights reserved.