
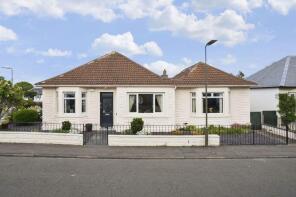
House Prices in Fisherrow
House prices in Fisherrow have an overall average of £236,261 over the last year.
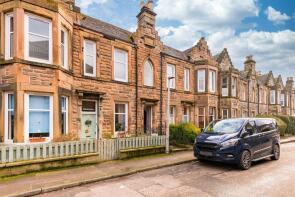
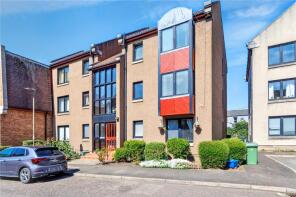
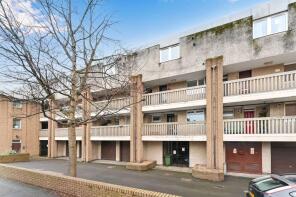
The majority of properties sold in Fisherrow during the last year were flats, selling for an average price of £188,140. Terraced properties sold for an average of £268,940, with semi-detached properties fetching £311,965.
Overall, the historical sold prices in Fisherrow over the last year were 8% up on the previous year and 2% down on the 2023 peak of £241,248.
Properties Sold
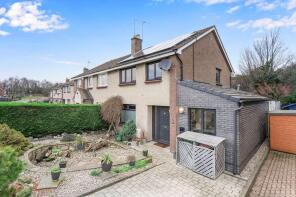
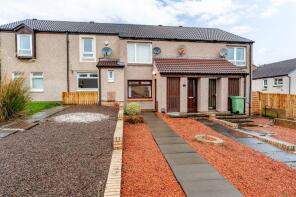
29, Campie Road, Fisherrow, Musselburgh EH21 6QX
| Today | See what it's worth now |
| 29 Apr 2026 | £290,000 |
| 14 Mar 2022 | £210,000 |
No other historical records.
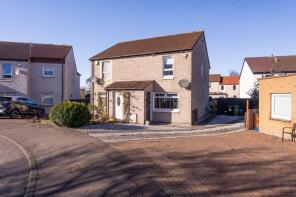
6, Newhailes Crescent, Newhailes, Musselburgh EH21 6DP
| Today | See what it's worth now |
| 29 Apr 2026 | £510,000 |
No other historical records.
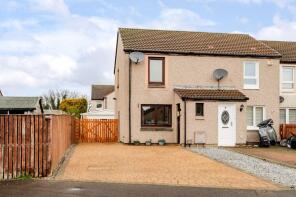
8b, Bellfield Avenue, Fisherrow, Musselburgh EH21 6QU
| Today | See what it's worth now |
| 28 Apr 2026 | £263,000 |
| 10 Apr 2019 | £211,111 |
1 Flat 2, Sunbury, Gracefield Court, Fisherrow, Musselburgh EH21 6LL
| Today | See what it's worth now |
| 28 Apr 2026 | £175,000 |
| 16 Dec 2024 | £140,000 |
8d, Beach Lane, Fisherrow, Musselburgh EH21 6LA
| Today | See what it's worth now |
| 27 Apr 2026 | £190,000 |
| 24 Mar 2026 | £195,000 |
38, Stoneyhill Drive, Stoneyhill, Musselburgh EH21 6SQ
| Today | See what it's worth now |
| 27 Apr 2026 | £383,200 |
No other historical records.
12, Fairways, Stoneybank, Musselburgh EH21 6SN

| Today | See what it's worth now |
| 23 Apr 2026 | £205,000 |
| 13 Aug 2014 | £135,000 |
No other historical records.
35, Stoneybank Drive, Stoneyhill, Musselburgh EH21 6TB
| Today | See what it's worth now |
| 20 Apr 2026 | £246,750 |
| 17 Sep 2018 | £186,000 |
57, Stoneyhill Road, Stoneyhill, Musselburgh EH21 6TW
| Today | See what it's worth now |
| 20 Apr 2026 | £220,269 |
| 29 Jun 2021 | £190,360 |
Flat 2, 9, Eskdale Mews, Fisherrow, Musselburgh EH21 6LN
| Today | See what it's worth now |
| 9 Apr 2026 | £146,000 |
No other historical records.
17, Eskview Road, Eskview, Musselburgh EH21 6PA

| Today | See what it's worth now |
| 8 Apr 2026 | £250,000 |
| 5 Apr 2007 | £150,250 |
67, Stoneybank Gardens (nos. 61 - 91), Stoneyhill, Musselburgh EH21 6TG
| Today | See what it's worth now |
| 27 Mar 2026 | £172,500 |
| 10 Oct 2019 | £125,750 |
No other historical records.
32e, Beach Lane, Fisherrow, Musselburgh EH21 6LB
| Today | See what it's worth now |
| 25 Mar 2026 | £159,725 |
| 10 Dec 2007 | £105,000 |
No other historical records.
13, Eskview Terrace, Eskview, Musselburgh EH21 6LT
| Today | See what it's worth now |
| 24 Mar 2026 | £172,500 |
| 21 Aug 2007 | £147,000 |
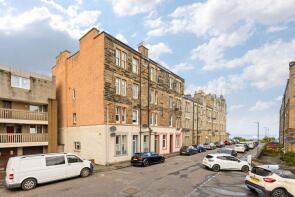
273c, North High Street, Fisherrow, Musselburgh EH21 6BQ
| Today | See what it's worth now |
| 24 Mar 2026 | £178,500 |
| 26 Feb 2007 | £118,400 |
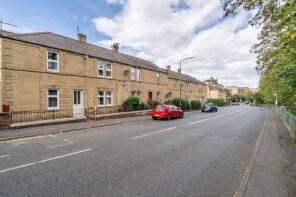
91, Market Street, Fisherrow, Musselburgh EH21 6PS
| Today | See what it's worth now |
| 23 Mar 2026 | £202,000 |
No other historical records.
4, Stoneyhill Road, Stoneyhill, Musselburgh EH21 6TH
| Today | See what it's worth now |
| 18 Mar 2026 | £200,000 |
| 29 Mar 2024 | £179,000 |
47c, North High Street, Fisherrow, Musselburgh EH21 6JA

| Today | See what it's worth now |
| 13 Mar 2026 | £203,333 |
| 28 Jul 2021 | £179,050 |
28, Hercus Loan, Fisherrow, Musselburgh EH21 6AY

| Today | See what it's worth now |
| 12 Mar 2026 | £201,280 |
No other historical records.
34a, South Street, Fisherrow, Musselburgh EH21 6AT
| Today | See what it's worth now |
| 11 Mar 2026 | £100,000 |
| 19 Nov 2008 | £110,000 |
No other historical records.
181d, North High Street, Fisherrow, Musselburgh EH21 6AN
| Today | See what it's worth now |
| 10 Mar 2026 | £290,000 |
| 27 Mar 2018 | £181,181 |
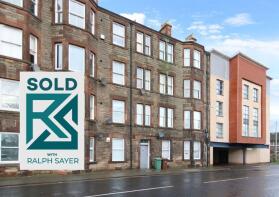
99, North High Street, Fisherrow, Musselburgh EH21 6JE
| Today | See what it's worth now |
| 9 Mar 2026 | £243,500 |
| 14 Sep 2015 | £135,000 |
3d, Harbour Court, Harbour Road, Fisherrow, Musselburgh EH21 6DL
| Today | See what it's worth now |
| 9 Mar 2026 | £170,000 |
| 30 Jul 2004 | £112,000 |
No other historical records.

Source Acknowledgement: © Crown copyright. Scottish house price data is publicly available information produced by the Registers of Scotland. Material has been reproduced with the permission of the Keeper of the Registers of Scotland and contains data compiled by Registers of Scotland. For further information, please contact data@ros.gov.uk. Please note the dates shown here relate to the property's registered date not sold date.This material was last updated on 10 July 2026. It covers the period from 8 December 1987 to 30 April 2026 and contains property transactions which have been registered during that period.
Disclaimer: Rightmove.co.uk provides this Registers of Scotland data "as is". The burden for fitness of the data relies completely with the user and is provided for informational purposes only. No warranty, express or implied, is given relating to the accuracy of content of the Registers of Scotland data and Rightmove plc does not accept any liability for error or omission. If you have found an error with the data or need further information please contact data@ros.gov.uk
Permitted Use: The Registers of Scotland allows the reproduction of the data which it provides to Rightmove.co.uk free of charge in any format or medium only for research, private study or for internal circulation within an organisation. This is subject to it being reproduced accurately and not used in a misleading context. The material must be acknowledged as Crown Copyright. You are not allowed to use this information for commercial purposes, nor must you copy, distribute, sell or publish the data in any way. For any other use of this material, please apply to the Registers of Scotland for a licence. You can do this online at www.ros.gov.uk, by email at data@ros.gov.uk or by writing to Business Development, Registers of Scotland, Meadowbank House, 153 London Road, Edinburgh EH8 7AU.
Rightmove takes no liability for your use of, or reliance on, Rightmove's Instant Valuation due to the limitations of our tracking tool listed here. Use of this tool is taken entirely at your own risk. All rights reserved.