
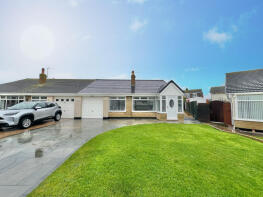
House Prices in Fleetwood
House prices in Fleetwood have an overall average of £147,386 over the last year.
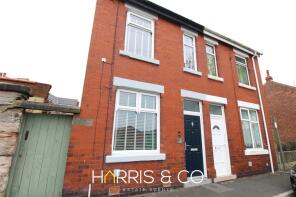
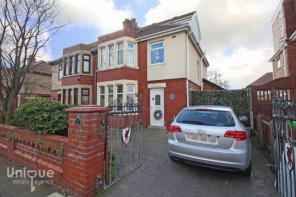
The majority of properties sold in Fleetwood during the last year were terraced properties, selling for an average price of £111,824. Semi-detached properties sold for an average of £163,549, with detached properties fetching £276,862.
Overall, the historical sold prices in Fleetwood over the last year were 2% down on the previous year and 1% down on the 2023 peak of £149,145.
Properties Sold
7, Wraywood Court, Fleetwood FY7 8RG
| Today | See what it's worth now |
| 22 Apr 2026 | £230,000 |
| 28 Nov 1997 | £53,000 |
No other historical records.
32, Custom House Lane, Fleetwood FY7 6BY
| Today | See what it's worth now |
| 21 Apr 2026 | £84,000 |
| 7 Jul 2021 | £75,000 |
27, Romney Avenue, Fleetwood FY7 8BW
| Today | See what it's worth now |
| 17 Apr 2026 | £170,000 |
| 28 Feb 2007 | £160,000 |
No other historical records.
105, Princes Way, Fleetwood FY7 8DX
| Today | See what it's worth now |
| 17 Apr 2026 | £392,000 |
| 24 Jul 2018 | £235,000 |
No other historical records.
1, Riversgate, Fleetwood FY7 7NZ
| Today | See what it's worth now |
| 15 Apr 2026 | £187,000 |
No other historical records.
47, Eden Avenue, Fleetwood FY7 8DH
| Today | See what it's worth now |
| 14 Apr 2026 | £125,000 |
| 22 Apr 2002 | £19,600 |
No other historical records.
7, Blakiston Street, Fleetwood FY7 6BA
| Today | See what it's worth now |
| 27 Mar 2026 | £113,500 |
| 4 Nov 2016 | £110,000 |
112, Broadway, Fleetwood FY7 8HE
| Today | See what it's worth now |
| 27 Mar 2026 | £230,000 |
| 7 Sep 2007 | £165,000 |
41, Burns Road, Fleetwood FY7 6RG

| Today | See what it's worth now |
| 27 Mar 2026 | £156,000 |
| 24 Jun 2022 | £105,000 |
14, Abercrombie Road, Fleetwood FY7 7AU
| Today | See what it's worth now |
| 25 Mar 2026 | £135,000 |
| 31 Oct 2007 | £128,000 |
18, High Gate, Fleetwood FY7 8AJ
| Today | See what it's worth now |
| 24 Mar 2026 | £188,000 |
| 22 Nov 2024 | £135,000 |
47, Kingfisher Way, Fleetwood FY7 8SB
| Today | See what it's worth now |
| 23 Mar 2026 | £157,000 |
| 25 Nov 2005 | £118,750 |
No other historical records.
4, Borrowdale Avenue, Fleetwood FY7 7LF

| Today | See what it's worth now |
| 20 Mar 2026 | £125,000 |
No other historical records.
67, Beach Road, Fleetwood FY7 8PW
| Today | See what it's worth now |
| 20 Mar 2026 | £210,000 |
| 23 Jun 2014 | £95,000 |
8, Holme Avenue, Fleetwood FY7 8JG
| Today | See what it's worth now |
| 18 Mar 2026 | £265,000 |
| 7 Oct 2020 | £220,000 |
72, Adelaide Street, Fleetwood FY7 6EE
| Today | See what it's worth now |
| 16 Mar 2026 | £112,000 |
| 4 Aug 2020 | £90,000 |
94, Preston Street, Fleetwood FY7 6LA
| Today | See what it's worth now |
| 13 Mar 2026 | £65,000 |
| 5 Oct 1999 | £28,500 |
No other historical records.
94, Hatfield Avenue, Fleetwood FY7 7DX
| Today | See what it's worth now |
| 9 Mar 2026 | £164,000 |
| 27 Oct 2023 | £159,950 |
63, Dronsfield Road, Fleetwood FY7 7BN
| Today | See what it's worth now |
| 6 Mar 2026 | £225,000 |
| 6 Sep 2019 | £115,000 |
14, Littlewood, Fleetwood FY7 7EJ
| Today | See what it's worth now |
| 6 Mar 2026 | £129,950 |
| 23 Nov 2006 | £140,000 |
3, Langwood Mews, Fleetwood FY7 8GT
| Today | See what it's worth now |
| 6 Mar 2026 | £135,000 |
| 25 Jun 2010 | £124,950 |
No other historical records.
5, Broadwater Avenue, Fleetwood FY7 7PP
| Today | See what it's worth now |
| 5 Mar 2026 | £75,000 |
No other historical records.
21, Upper Lune Street, Fleetwood FY7 6BP

| Today | See what it's worth now |
| 2 Mar 2026 | £90,000 |
| 22 Jun 2011 | £75,000 |

Source Acknowledgement: © Crown copyright. England and Wales house price data is publicly available information produced by the HM Land Registry.This material was last updated on 9 July 2026. It covers the period from 1 January 1995 to 30 April 2026 and contains property transactions which have been registered during that period. Contains HM Land Registry data © Crown copyright and database right 2026. This data is licensed under the Open Government Licence v3.0.
Disclaimer: Rightmove.co.uk provides this HM Land Registry data "as is". The burden for fitness of the data relies completely with the user and is provided for informational purposes only. No warranty, express or implied, is given relating to the accuracy of content of the HM Land Registry data and Rightmove does not accept any liability for error or omission. If you have found an error with the data or need further information please contact HM Land Registry.
Permitted Use: Viewers of this Information are granted permission to access this Crown copyright material and to download it onto electronic, magnetic, optical or similar storage media provided that such activities are for private research, study or in-house use only. Any other use of the material requires the formal written permission of Land Registry which can be requested from us, and is subject to an additional licence and associated charge.
Rightmove takes no liability for your use of, or reliance on, Rightmove's Instant Valuation due to the limitations of our tracking tool listed here. Use of this tool is taken entirely at your own risk. All rights reserved.