
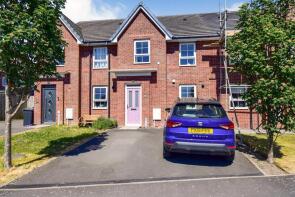
House Prices in Flimby Station
House prices in Flimby Station have an overall average of £116,109 over the last year.
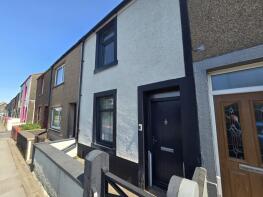
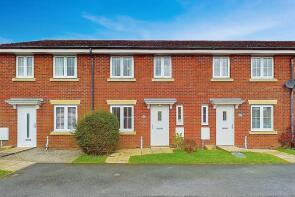
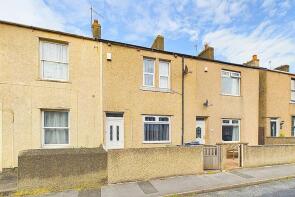
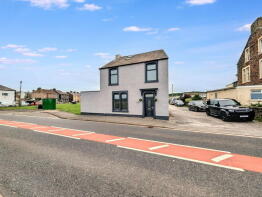
The majority of properties sold in Flimby Station during the last year were terraced properties, selling for an average price of £97,720. Semi-detached properties sold for an average of £300,000.
Overall, the historical sold prices in Flimby Station over the last year were 27% up on the previous year and 5% up on the 2011 peak of £110,470.
Properties Sold
Churriana, West Lane, Maryport CA15 8RL
| Today | See what it's worth now |
| 30 Jan 2026 | £300,000 |
| 22 Jun 2000 | £66,000 |
No other historical records.
6, Mason Terrace, Flimby CA15 8QT
| Today | See what it's worth now |
| 23 Jan 2026 | £103,500 |
No other historical records.
4, Thompsons Terrace, Ryehill Road, Maryport CA15 8QA
| Today | See what it's worth now |
| 5 Dec 2025 | £63,000 |
| 6 Jan 2009 | £51,000 |
No other historical records.
32, Ryehill Road, Maryport CA15 8PS
| Today | See what it's worth now |
| 24 Nov 2025 | £155,000 |
| 11 Apr 2003 | £69,950 |
27, Farmers Way, Maryport CA15 8PQ
| Today | See what it's worth now |
| 7 Nov 2025 | £152,500 |
| 3 Sep 2021 | £120,000 |
10, St Nicholas Avenue, Maryport CA15 8QZ
| Today | See what it's worth now |
| 31 Oct 2025 | £80,000 |
| 1 Nov 2002 | £35,500 |
No other historical records.
29, Westfield View, Maryport CA15 8RJ
| Today | See what it's worth now |
| 21 Oct 2025 | £107,000 |
| 23 Sep 2022 | £83,500 |
6, Margaret Street, Maryport CA15 8PP

| Today | See what it's worth now |
| 19 Sep 2025 | £65,000 |
| 18 Feb 2005 | £58,000 |
No other historical records.
13, St Helens Avenue, Flimby CA15 8RB
| Today | See what it's worth now |
| 14 Aug 2025 | £60,000 |
No other historical records.
10, Chapel Street, Maryport CA15 8QG

| Today | See what it's worth now |
| 25 Jul 2025 | £121,200 |
| 31 Oct 2003 | £48,000 |
No other historical records.
8, Co-operative Terrace, Ryehill Road, Flimby CA15 8PR
| Today | See what it's worth now |
| 3 Jul 2025 | £70,000 |
No other historical records.
29, Station Road, Maryport CA15 8QN
| Today | See what it's worth now |
| 30 May 2025 | £60,000 |
| 4 Oct 2019 | £45,000 |
10, Farmers Way, Maryport CA15 8PQ
| Today | See what it's worth now |
| 27 May 2025 | £115,000 |
| 18 Dec 2020 | £110,000 |
12, Farmers Way, Maryport CA15 8PQ
| Today | See what it's worth now |
| 23 May 2025 | £112,000 |
| 27 Sep 2013 | £115,995 |
No other historical records.
18, Wedgwood Road, Maryport CA15 8QX

| Today | See what it's worth now |
| 10 Mar 2025 | £125,000 |
| 25 Jul 2008 | £97,500 |
10, Brook Street, Maryport CA15 8QE
| Today | See what it's worth now |
| 6 Dec 2024 | £109,995 |
| 11 Oct 2019 | £49,950 |
16, Brook Street, Maryport CA15 8QE

| Today | See what it's worth now |
| 29 Nov 2024 | £81,000 |
| 22 Sep 2021 | £68,000 |
Sea View, Main Road, Maryport CA15 8QW
| Today | See what it's worth now |
| 15 Nov 2024 | £67,000 |
| 12 May 2017 | £110,000 |
19, Ryehill Road, Maryport CA15 8PJ
| Today | See what it's worth now |
| 12 Aug 2024 | £130,000 |
| 8 May 2019 | £115,000 |
17, Ryehill Road, Maryport CA15 8PJ
| Today | See what it's worth now |
| 19 Jul 2024 | £114,000 |
| 1 Feb 2019 | £82,000 |
6b, Station Road, Maryport CA15 8QN

| Today | See what it's worth now |
| 5 Jul 2024 | £62,500 |
No other historical records.
33, Station Road, Flimby CA15 8QN
| Today | See what it's worth now |
| 25 Jun 2024 | £33,000 |
No other historical records.
42, School Drive, Maryport CA15 8PL
| Today | See what it's worth now |
| 28 May 2024 | £85,000 |
No other historical records.

Source Acknowledgement: © Crown copyright. England and Wales house price data is publicly available information produced by the HM Land Registry.This material was last updated on 15 May 2026. It covers the period from 1 January 1995 to 31 March 2026 and contains property transactions which have been registered during that period. Contains HM Land Registry data © Crown copyright and database right 2026. This data is licensed under the Open Government Licence v3.0.
Disclaimer: Rightmove.co.uk provides this HM Land Registry data "as is". The burden for fitness of the data relies completely with the user and is provided for informational purposes only. No warranty, express or implied, is given relating to the accuracy of content of the HM Land Registry data and Rightmove does not accept any liability for error or omission. If you have found an error with the data or need further information please contact HM Land Registry.
Permitted Use: Viewers of this Information are granted permission to access this Crown copyright material and to download it onto electronic, magnetic, optical or similar storage media provided that such activities are for private research, study or in-house use only. Any other use of the material requires the formal written permission of Land Registry which can be requested from us, and is subject to an additional licence and associated charge.
Rightmove takes no liability for your use of, or reliance on, Rightmove's Instant Valuation due to the limitations of our tracking tool listed here. Use of this tool is taken entirely at your own risk. All rights reserved.