
House Prices in Flint Hill
House prices in Flint Hill have an overall average of £166,450 over the last year.
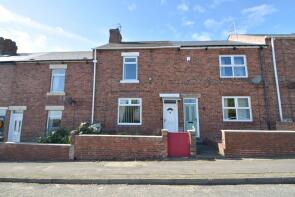
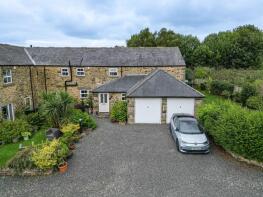
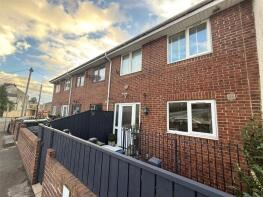
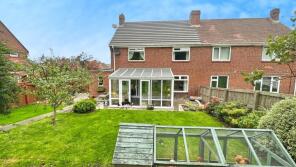
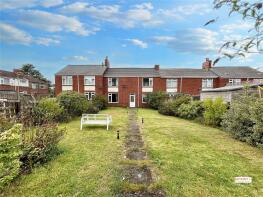
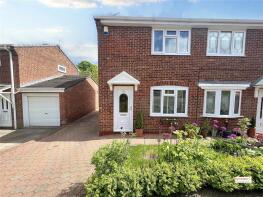
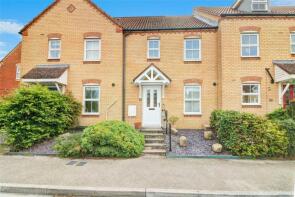
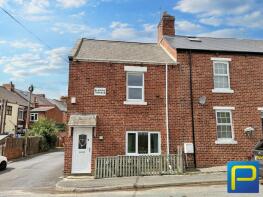
The majority of properties sold in Flint Hill during the last year were terraced properties, selling for an average price of £143,815. Semi-detached properties sold for an average of £143,686, with detached properties fetching £299,286.
Overall, the historical sold prices in Flint Hill over the last year were 4% down on the previous year and 13% up on the 2023 peak of £147,583.
Properties Sold
2, Leith View, Road Leading To The Commercial, Stanley DH9 9RR

| Today | See what it's worth now |
| 10 Apr 2026 | £490,000 |
| 13 Sep 2018 | £240,000 |
4, Blanche Terrace, B6173 Through Tantobie, Tantobie DH9 9TE
| Today | See what it's worth now |
| 7 Apr 2026 | £65,000 |
No other historical records.
4, Bushblades Mews, Bushblades Lane, Stanley DH9 9UF
| Today | See what it's worth now |
| 20 Mar 2026 | £462,500 |
| 14 May 2004 | £345,000 |
1, Highview Court, North Road, Stanley DH9 9JX
| Today | See what it's worth now |
| 13 Mar 2026 | £156,000 |
| 25 Mar 2010 | £100,000 |
No other historical records.
10, Pontopsyde, Stanley DH9 9EG
| Today | See what it's worth now |
| 27 Feb 2026 | £140,500 |
| 28 Feb 2013 | £92,000 |
No other historical records.
16, Mount Pleasant, Stanley DH9 9BL

| Today | See what it's worth now |
| 26 Feb 2026 | £200,000 |
| 12 Dec 2022 | £180,000 |
103, Lily Gardens, Stanley DH9 9BH
| Today | See what it's worth now |
| 29 Jan 2026 | £127,500 |
| 12 Oct 2022 | £115,000 |
63, The Grange, Stanley DH9 9UT
| Today | See what it's worth now |
| 19 Jan 2026 | £145,000 |
| 4 Jun 2018 | £105,000 |
No other historical records.
19, Ewehurst Road, Stanley DH9 9LR
| Today | See what it's worth now |
| 16 Jan 2026 | £132,000 |
| 31 May 2017 | £120,000 |
1, Blanche Terrace, B6173 Through Tantobie, Stanley DH9 9TE
| Today | See what it's worth now |
| 16 Jan 2026 | £73,500 |
| 25 Nov 2021 | £75,000 |
3, Leith Gardens, Tanfield Lea DH9 9LZ
| Today | See what it's worth now |
| 9 Jan 2026 | £55,000 |
No other historical records.
51, Lily Gardens, Stanley DH9 9BQ
| Today | See what it's worth now |
| 16 Dec 2025 | £236,100 |
| 19 Jul 2023 | £220,000 |
9, Coleridge Gardens, Stanley DH9 9LH
| Today | See what it's worth now |
| 5 Dec 2025 | £120,000 |
| 12 Sep 2023 | £107,000 |
No other historical records.
38, Fairhills Avenue, Stanley DH9 9DY

| Today | See what it's worth now |
| 5 Dec 2025 | £170,000 |
| 7 Mar 2025 | £159,000 |
7, Bowmont Drive, Stanley DH9 9PF
| Today | See what it's worth now |
| 4 Dec 2025 | £173,000 |
| 15 Apr 2011 | £124,950 |
No other historical records.
10, Mitchell Terrace, Stanley DH9 9TN
| Today | See what it's worth now |
| 4 Dec 2025 | £107,500 |
| 24 Aug 2021 | £80,500 |
47, Woodburn, Stanley DH9 9UR
| Today | See what it's worth now |
| 1 Dec 2025 | £255,000 |
| 13 Dec 1996 | £77,000 |
No other historical records.
3, Old Rectory Close, Stanley DH9 9PZ
| Today | See what it's worth now |
| 28 Nov 2025 | £350,000 |
| 25 May 2002 | £165,000 |
No other historical records.
5, Bowes Terrace, Stanley DH9 9HF

| Today | See what it's worth now |
| 25 Nov 2025 | £100,000 |
| 4 Oct 2019 | £88,000 |
No other historical records.
18, Mount Pleasant, Dipton DH9 9BL
| Today | See what it's worth now |
| 17 Nov 2025 | £250,000 |
No other historical records.
45, Sunset View, Stanley DH9 9LA
| Today | See what it's worth now |
| 14 Nov 2025 | £170,000 |
| 31 Mar 2017 | £124,950 |
13, George Street, Stanley DH9 9HD
| Today | See what it's worth now |
| 31 Oct 2025 | £110,000 |
| 7 May 2024 | £100,000 |
31, Errington Drive, Stanley DH9 9PD
| Today | See what it's worth now |
| 24 Oct 2025 | £252,500 |
| 1 Apr 2019 | £170,000 |
No other historical records.
Source Acknowledgement: © Crown copyright. England and Wales house price data is publicly available information produced by the HM Land Registry.This material was last updated on 9 July 2026. It covers the period from 1 January 1995 to 30 April 2026 and contains property transactions which have been registered during that period. Contains HM Land Registry data © Crown copyright and database right 2026. This data is licensed under the Open Government Licence v3.0.
Disclaimer: Rightmove.co.uk provides this HM Land Registry data "as is". The burden for fitness of the data relies completely with the user and is provided for informational purposes only. No warranty, express or implied, is given relating to the accuracy of content of the HM Land Registry data and Rightmove does not accept any liability for error or omission. If you have found an error with the data or need further information please contact HM Land Registry.
Permitted Use: Viewers of this Information are granted permission to access this Crown copyright material and to download it onto electronic, magnetic, optical or similar storage media provided that such activities are for private research, study or in-house use only. Any other use of the material requires the formal written permission of Land Registry which can be requested from us, and is subject to an additional licence and associated charge.
Rightmove takes no liability for your use of, or reliance on, Rightmove's Instant Valuation due to the limitations of our tracking tool listed here. Use of this tool is taken entirely at your own risk. All rights reserved.