
House Prices in Fradley
House prices in Fradley have an overall average of £353,767 over the last year.
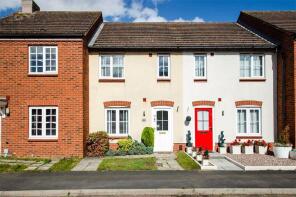
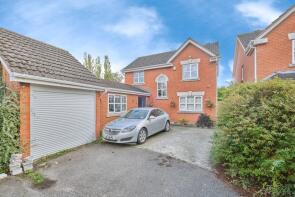
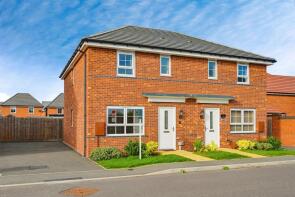
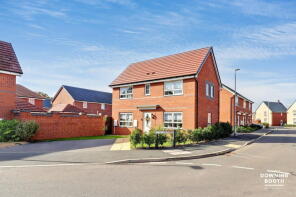
The majority of properties sold in Fradley during the last year were detached properties, selling for an average price of £469,977. Terraced properties sold for an average of £237,647, with semi-detached properties fetching £256,667.
Overall, the historical sold prices in Fradley over the last year were 10% down on the previous year and 8% down on the 2023 peak of £386,557.
Properties Sold
25, Rogerson Road, Fradley, Lichfield WS13 8PE
| Today | See what it's worth now |
| 24 Apr 2026 | £220,000 |
| 9 Aug 2021 | £158,000 |
No other historical records.
12, Alexander Close, Fradley, Lichfield WS13 8SH
| Today | See what it's worth now |
| 20 Apr 2026 | £325,000 |
| 2 Feb 2007 | £193,000 |
19, Goring Drive, Fradley, Lichfield WS13 8ZB
| Today | See what it's worth now |
| 13 Apr 2026 | £290,000 |
| 24 Jun 2022 | £278,995 |
No other historical records.
1, Mansell Avenue, Fradley, Lichfield WS13 8ZH
| Today | See what it's worth now |
| 26 Mar 2026 | £348,000 |
| 26 May 2023 | £344,995 |
No other historical records.
59, Common Lane, Fradley, Lichfield WS13 8TG
| Today | See what it's worth now |
| 23 Mar 2026 | £495,000 |
| 15 Apr 2019 | £360,001 |
24, Wyndham Wood Close, Fradley, Lichfield WS13 8UZ
| Today | See what it's worth now |
| 20 Mar 2026 | £500,000 |
| 31 Jan 2020 | £370,000 |
3, Walker Drive, Fradley, Lichfield WS13 8XX

| Today | See what it's worth now |
| 6 Mar 2026 | £240,000 |
| 6 Jan 2023 | £234,500 |
No other historical records.
15, Bryant Avenue, Fradley, Lichfield WS13 8GU
| Today | See what it's worth now |
| 27 Feb 2026 | £230,000 |
| 6 Jul 2017 | £163,995 |
No other historical records.
5, Ward Close, Fradley, Lichfield WS13 8TS
| Today | See what it's worth now |
| 18 Feb 2026 | £370,000 |
| 19 Aug 2004 | £244,950 |
No other historical records.
5, Sayles Grove, Fradley, Lichfield WS13 8WX
| Today | See what it's worth now |
| 30 Jan 2026 | £375,000 |
| 15 Jan 2021 | £294,995 |
No other historical records.
9, Williams Avenue, Fradley, Lichfield WS13 8TE
| Today | See what it's worth now |
| 30 Jan 2026 | £280,000 |
| 28 Sep 2018 | £197,500 |
25, Statfold Lane, Fradley, Lichfield WS13 8NY
| Today | See what it's worth now |
| 29 Jan 2026 | £475,000 |
No other historical records.
5, Luther Way, Fradley, Lichfield WS13 8XS
| Today | See what it's worth now |
| 21 Jan 2026 | £375,000 |
| 11 Mar 2022 | £319,995 |
No other historical records.
1, Robinson Lane, Fradley, Lichfield WS13 8ZL
| Today | See what it's worth now |
| 18 Dec 2025 | £540,000 |
| 3 Feb 2023 | £511,401 |
No other historical records.
10, Mellor Drive, Fradley, Lichfield WS13 8ZA

| Today | See what it's worth now |
| 17 Dec 2025 | £170,000 |
No other historical records.
1, Milne Avenue, Fradley, Lichfield WS13 8SQ
| Today | See what it's worth now |
| 12 Dec 2025 | £295,000 |
| 15 Sep 2021 | £280,000 |
23, Long Lane, Fradley, Lichfield WS13 8NS
| Today | See what it's worth now |
| 11 Dec 2025 | £765,000 |
No other historical records.
3, Jones Close, Fradley, Lichfield WS13 8UD
| Today | See what it's worth now |
| 21 Nov 2025 | £577,500 |
| 4 Aug 2000 | £239,950 |
No other historical records.
52, Statfold Lane, Fradley, Lichfield WS13 8NY
| Today | See what it's worth now |
| 21 Nov 2025 | £470,000 |
| 7 Jun 2018 | £330,000 |
No other historical records.
63, Williams Avenue, Fradley, Lichfield WS13 8TE
| Today | See what it's worth now |
| 14 Nov 2025 | £285,000 |
| 3 Mar 2022 | £255,000 |
5, Bromwich Drive, Fradley, Lichfield WS13 8SD
| Today | See what it's worth now |
| 14 Nov 2025 | £410,000 |
| 5 Sep 2014 | £300,000 |
No other historical records.
12, Wyndham Wood Close, Fradley, Lichfield WS13 8UZ
| Today | See what it's worth now |
| 11 Nov 2025 | £575,000 |
| 20 Jul 2001 | £249,950 |
44, Tye Road, Fradley, Lichfield WS13 8GW
| Today | See what it's worth now |
| 31 Oct 2025 | £280,000 |
| 6 Jul 2018 | £221,750 |
No other historical records.
Source Acknowledgement: © Crown copyright. England and Wales house price data is publicly available information produced by the HM Land Registry.This material was last updated on 9 July 2026. It covers the period from 1 January 1995 to 30 April 2026 and contains property transactions which have been registered during that period. Contains HM Land Registry data © Crown copyright and database right 2026. This data is licensed under the Open Government Licence v3.0.
Disclaimer: Rightmove.co.uk provides this HM Land Registry data "as is". The burden for fitness of the data relies completely with the user and is provided for informational purposes only. No warranty, express or implied, is given relating to the accuracy of content of the HM Land Registry data and Rightmove does not accept any liability for error or omission. If you have found an error with the data or need further information please contact HM Land Registry.
Permitted Use: Viewers of this Information are granted permission to access this Crown copyright material and to download it onto electronic, magnetic, optical or similar storage media provided that such activities are for private research, study or in-house use only. Any other use of the material requires the formal written permission of Land Registry which can be requested from us, and is subject to an additional licence and associated charge.
Rightmove takes no liability for your use of, or reliance on, Rightmove's Instant Valuation due to the limitations of our tracking tool listed here. Use of this tool is taken entirely at your own risk. All rights reserved.