
House Prices in Fritchley
House prices in Fritchley have an overall average of £470,583 over the last year.
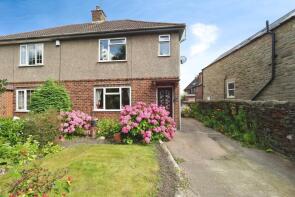
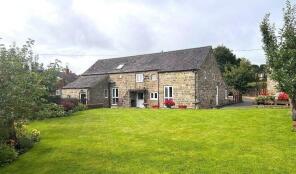
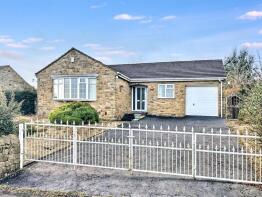
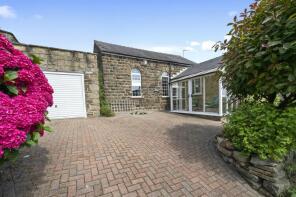
The majority of properties sold in Fritchley during the last year were detached properties, selling for an average price of £580,000. Semi-detached properties sold for an average of £251,750.
Overall, the historical sold prices in Fritchley over the last year were 5% up on the previous year and 3% up on the 2021 peak of £454,715.
Properties Sold
Fairfield, Bobbin Mill Hill, Fritchley, Belper DE56 2HN
| Today | See what it's worth now |
| 5 Mar 2026 | £550,000 |
| 14 May 2021 | £400,000 |
7 Lyn Dene, Top Hagg Lane, Fritchley, Belper DE56 2HJ
| Today | See what it's worth now |
| 12 Feb 2026 | £308,500 |
| 24 Nov 2014 | £221,500 |
Bobbin Mill Cottage, Bobbin Mill Hill, Fritchley, Belper DE56 2HN

| Today | See what it's worth now |
| 28 Jan 2026 | £900,000 |
| 23 Oct 2009 | £276,000 |
No other historical records.
Cobblers Cottage, Chapel Street, Fritchley, Belper DE56 2FR
| Today | See what it's worth now |
| 18 Dec 2025 | £350,000 |
| 22 Feb 2008 | £208,000 |
No other historical records.
Cherry House, Fritchley Lane, Fritchley, Belper DE56 2FN
| Today | See what it's worth now |
| 11 Dec 2025 | £520,000 |
No other historical records.
1, Chapel Street, Fritchley, Belper DE56 2FR
| Today | See what it's worth now |
| 25 Jul 2025 | £195,000 |
No other historical records.
Hilltop Farm, Fritchley Lane, Fritchley, Belper DE56 2FN
| Today | See what it's worth now |
| 16 Jun 2025 | £500,000 |
No other historical records.
Amberdale, Bowmer Lane, Fritchley, Belper DE56 2FY
| Today | See what it's worth now |
| 30 Apr 2025 | £451,150 |
No other historical records.
Church Farm Cottages, Church Street, Fritchley, Belper DE56 2FQ
| Today | See what it's worth now |
| 27 Mar 2025 | £380,000 |
No other historical records.
Thorndale Cottage, The Dimple, Fritchley, Belper DE56 2HP
| Today | See what it's worth now |
| 26 Mar 2025 | £810,000 |
| 16 Dec 2016 | £417,500 |
No other historical records.
Merryn Cottage, Chapel Street, Fritchley, Belper DE56 2FR
| Today | See what it's worth now |
| 16 Dec 2024 | £315,000 |
| 11 Jun 2018 | £272,000 |
No other historical records.
Howghyll, Allen Lane, Fritchley, Belper DE56 2FX
| Today | See what it's worth now |
| 28 Nov 2024 | £620,000 |
No other historical records.
6, Greenfields, Fritchley, Belper DE56 2FP
| Today | See what it's worth now |
| 22 Nov 2024 | £224,000 |
| 22 Aug 1997 | £59,950 |
No other historical records.
Orchard Lodge, Allen Lane, Fritchley, Belper DE56 2FX
| Today | See what it's worth now |
| 11 Oct 2024 | £475,000 |
No other historical records.
26, Church Street, Fritchley, Belper DE56 2FQ

| Today | See what it's worth now |
| 30 Aug 2024 | £277,000 |
| 21 Sep 2018 | £208,000 |
Orchard Cottage, Allen Lane, Fritchley, Belper DE56 2FX

| Today | See what it's worth now |
| 8 May 2024 | £615,000 |
No other historical records.
4, Dale Close, Fritchley, Belper DE56 2HZ
| Today | See what it's worth now |
| 2 May 2024 | £235,000 |
No other historical records.
Stoneycroft, Crich Common, Fritchley, Belper DE56 2FL
| Today | See what it's worth now |
| 29 Feb 2024 | £285,000 |
No other historical records.
25 The Nook, Chadwick Nick Lane, Fritchley, Belper DE56 2HL

| Today | See what it's worth now |
| 12 Feb 2024 | £530,000 |
No other historical records.
12, Dale Close, Fritchley, Belper DE56 2HZ

| Today | See what it's worth now |
| 20 Nov 2023 | £280,000 |
No other historical records.
26 Chellstones, Fritchley Lane, Fritchley, Belper DE56 2FN
| Today | See what it's worth now |
| 24 Oct 2023 | £150,000 |
No other historical records.
2, Greenfields, Fritchley, Belper DE56 2FP

| Today | See what it's worth now |
| 16 Dec 2022 | £335,000 |
| 26 Oct 2001 | £59,000 |
No other historical records.
2, Hilltop, Fritchley, Belper DE56 2GB

| Today | See what it's worth now |
| 30 Nov 2022 | £255,000 |
| 26 Sep 1997 | £34,500 |
No other historical records.
Source Acknowledgement: © Crown copyright. England and Wales house price data is publicly available information produced by the HM Land Registry.This material was last updated on 15 May 2026. It covers the period from 1 January 1995 to 31 March 2026 and contains property transactions which have been registered during that period. Contains HM Land Registry data © Crown copyright and database right 2026. This data is licensed under the Open Government Licence v3.0.
Disclaimer: Rightmove.co.uk provides this HM Land Registry data "as is". The burden for fitness of the data relies completely with the user and is provided for informational purposes only. No warranty, express or implied, is given relating to the accuracy of content of the HM Land Registry data and Rightmove does not accept any liability for error or omission. If you have found an error with the data or need further information please contact HM Land Registry.
Permitted Use: Viewers of this Information are granted permission to access this Crown copyright material and to download it onto electronic, magnetic, optical or similar storage media provided that such activities are for private research, study or in-house use only. Any other use of the material requires the formal written permission of Land Registry which can be requested from us, and is subject to an additional licence and associated charge.
Rightmove takes no liability for your use of, or reliance on, Rightmove's Instant Valuation due to the limitations of our tracking tool listed here. Use of this tool is taken entirely at your own risk. All rights reserved.