
House Prices in Gelliwen
House prices in Gelliwen have an overall average of £325,250 over the last year.
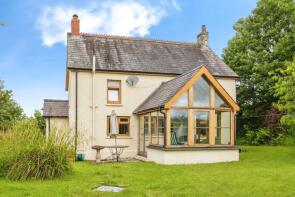
The majority of properties sold in Gelliwen during the last year were detached properties, selling for an average price of £389,846. Semi-detached properties sold for an average of £157,300.
Overall, the historical sold prices in Gelliwen over the last year were 25% up on the previous year and 4% down on the 2022 peak of £339,174.
Properties Sold
Llygadyrhaul, C2045 From, Talog, Carmarthen SA33 6PD
| Today | See what it's worth now |
| 3 Mar 2026 | £295,000 |
| 5 Oct 2012 | £113,000 |
The Heathers, C2035 From Trelech To Gellywen, Trelech, Carmarthen SA33 6RT

| Today | See what it's worth now |
| 6 Feb 2026 | £425,000 |
| 14 Dec 2020 | £317,500 |
No other historical records.
Minyrafon, C2043 From Trevaughan To Cynwyl Elfed, Trawsmawr, Carmarthen SA33 6NA
| Today | See what it's worth now |
| 5 Jan 2026 | £335,000 |
| 7 Jan 2022 | £320,000 |
Gelli, U2016 From, Penybont, Carmarthen SA33 6QA
| Today | See what it's worth now |
| 19 Dec 2025 | £750,000 |
| 1 Apr 2013 | £420,000 |
No other historical records.
Trewen, Trelech To Bryniwan, Trelech, Carmarthen SA33 6RU
| Today | See what it's worth now |
| 12 Nov 2025 | £260,000 |
| 23 Sep 2020 | £205,000 |
No other historical records.
Derlwyn Isaf, Blaenycoed C1313 - Maniwan B4299, Blaenycoed, Carmarthen SA33 6ET
| Today | See what it's worth now |
| 10 Nov 2025 | £348,000 |
| 17 Jun 2016 | £225,000 |
Arosfa, C2045 From, Talog, Carmarthen SA33 6NY
| Today | See what it's worth now |
| 31 Oct 2025 | £163,000 |
No other historical records.
Ffynnon Wen, Gwili Railway To Cynwyl Elfed, Cynwyl Elfed, Carmarthen SA33 6AR
| Today | See what it's worth now |
| 14 Oct 2025 | £305,000 |
| 10 Jun 2021 | £220,000 |
No other historical records.
16, Maesydderwen, Cwmdwyfran, Carmarthen SA33 6JE
| Today | See what it's worth now |
| 14 Oct 2025 | £153,000 |
| 27 May 2022 | £169,950 |
No other historical records.
Shalom, Cynwyl Elfed, Carmarthen SA33 6AR
| Today | See what it's worth now |
| 6 Oct 2025 | £115,000 |
No other historical records.
School House, Trelech To Bryniwan, Trelech, Carmarthen SA33 6RU
| Today | See what it's worth now |
| 30 Sep 2025 | £127,500 |
No other historical records.
Rock Cottage, C2043 From Trevaughan To Cynwyl Elfed, Trawsmawr, Carmarthen SA33 6NA
| Today | See what it's worth now |
| 25 Sep 2025 | £350,000 |
| 4 Jul 2017 | £195,000 |
Brynbach, C2045 From, Talog, Carmarthen SA33 6PB
| Today | See what it's worth now |
| 25 Jul 2025 | £570,000 |
| 16 Dec 2016 | £365,000 |
No other historical records.
Clynmaenllwyd, Cynwyl Elfed, Carmarthen SA33 6ST
| Today | See what it's worth now |
| 22 Jul 2025 | £535,000 |
No other historical records.
Melodi, Bronwydd To Gwili Railway, Bronwydd, Carmarthen SA33 6JA

| Today | See what it's worth now |
| 16 Jul 2025 | £560,000 |
| 13 Oct 2017 | £375,000 |
No other historical records.
Hafan Y Gan, Gwili Railway To Cynwyl Elfed, Cynwyl Elfed, Carmarthen SA33 6TL
| Today | See what it's worth now |
| 11 Jul 2025 | £178,000 |
| 21 Apr 2016 | £96,000 |
Railway View, Bronwydd To Gwili Railway, Bronwydd, Carmarthen SA33 6JG

| Today | See what it's worth now |
| 11 Jul 2025 | £165,000 |
| 30 May 2012 | £112,000 |
Henffordd, Blaenycoed - Cynnwyl Elfed, Blaenycoed, Carmarthen SA33 6ES
| Today | See what it's worth now |
| 4 Jul 2025 | £220,000 |
| 10 Sep 1999 | £46,000 |
No other historical records.
Brynmair, Blaenycoed C1313 - Maniwan B4299, Blaenycoed, Carmarthen SA33 6EU
| Today | See what it's worth now |
| 21 May 2025 | £141,000 |
No other historical records.
Llysmyfyr, Gwili Railway To Cynwyl Elfed, Cynwyl Elfed, Carmarthen SA33 6TL
| Today | See what it's worth now |
| 15 May 2025 | £147,500 |
| 10 Feb 2012 | £100,000 |
No other historical records.
Rock House, Cynwyl Elfed, Carmarthen SA33 6AR
| Today | See what it's worth now |
| 12 May 2025 | £100,000 |
No other historical records.
Hendre, Pantybwlch To Cynwyl Elfed, Hermon, Carmarthen SA33 6SR
| Today | See what it's worth now |
| 17 Apr 2025 | £415,000 |
| 26 Oct 2018 | £265,000 |
No other historical records.
The Manse, C2043 From Trevaughan To Cynwyl Elfed, Trawsmawr, Carmarthen SA33 6NA
| Today | See what it's worth now |
| 28 Mar 2025 | £191,000 |
| 22 Mar 2019 | £200,000 |
Source Acknowledgement: © Crown copyright. England and Wales house price data is publicly available information produced by the HM Land Registry.This material was last updated on 9 July 2026. It covers the period from 1 January 1995 to 30 April 2026 and contains property transactions which have been registered during that period. Contains HM Land Registry data © Crown copyright and database right 2026. This data is licensed under the Open Government Licence v3.0.
Disclaimer: Rightmove.co.uk provides this HM Land Registry data "as is". The burden for fitness of the data relies completely with the user and is provided for informational purposes only. No warranty, express or implied, is given relating to the accuracy of content of the HM Land Registry data and Rightmove does not accept any liability for error or omission. If you have found an error with the data or need further information please contact HM Land Registry.
Permitted Use: Viewers of this Information are granted permission to access this Crown copyright material and to download it onto electronic, magnetic, optical or similar storage media provided that such activities are for private research, study or in-house use only. Any other use of the material requires the formal written permission of Land Registry which can be requested from us, and is subject to an additional licence and associated charge.
Rightmove takes no liability for your use of, or reliance on, Rightmove's Instant Valuation due to the limitations of our tracking tool listed here. Use of this tool is taken entirely at your own risk. All rights reserved.