
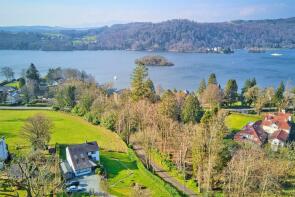
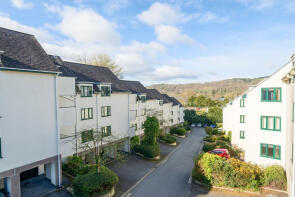
House Prices in Ghyll Head
House prices in Ghyll Head have an overall average of £483,458 over the last year.
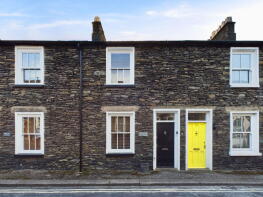
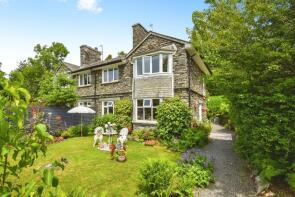
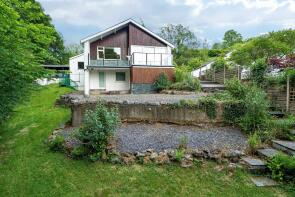
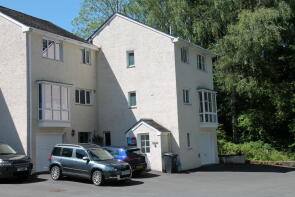
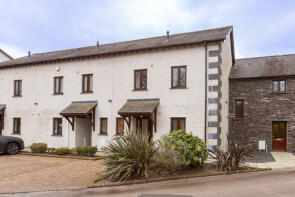
The majority of properties sold in Ghyll Head during the last year were detached properties, selling for an average price of £776,714. Terraced properties sold for an average of £369,000, with semi-detached properties fetching £341,667.
Overall, the historical sold prices in Ghyll Head over the last year were 28% down on the previous year and 19% down on the 2022 peak of £598,555.
Properties Sold
Tullabrig, Black Beck Wood, Windermere LA23 3LS
| Today | See what it's worth now |
| 21 Apr 2026 | £750,000 |
| 26 Mar 2021 | £725,000 |
3, Spinnery Cottage, Brantfell Road, Bowness-on-windermere LA23 3AE
| Today | See what it's worth now |
| 20 Mar 2026 | £169,000 |
| 14 Sep 2004 | £112,500 |
No other historical records.
7, Winander, Ferry View, Windermere LA23 3JB
| Today | See what it's worth now |
| 10 Mar 2026 | £125,000 |
| 7 May 2003 | £80,000 |
No other historical records.
Fawns Keep, Tower Wood, Windermere LA23 3PN
| Today | See what it's worth now |
| 17 Feb 2026 | £875,000 |
| 29 Jan 2021 | £330,000 |
4, Belle Isle View, Windermere LA23 3AW

| Today | See what it's worth now |
| 13 Feb 2026 | £280,000 |
| 29 Mar 2018 | £200,000 |
No other historical records.
12, South Terrace, Windermere LA23 3BH
| Today | See what it's worth now |
| 30 Jan 2026 | £305,000 |
| 24 Sep 2010 | £215,000 |
High Ludderburn Cottage, Cartmel Fell, Windermere LA23 3PD
| Today | See what it's worth now |
| 23 Jan 2026 | £525,000 |
No other historical records.
The Cottage, Birkett Hill, Windermere LA23 3EZ
| Today | See what it's worth now |
| 21 Jan 2026 | £420,000 |
| 28 Jun 2021 | £360,000 |
No other historical records.
7, Rayrigg Rise, Windermere LA23 3DR
| Today | See what it's worth now |
| 16 Jan 2026 | £690,000 |
| 15 Dec 2016 | £625,000 |
2, Ferry View, Windermere LA23 3JB

| Today | See what it's worth now |
| 12 Dec 2025 | £295,000 |
| 19 May 2004 | £100,000 |
15, Fallbarrow Court, Windermere LA23 3DX

| Today | See what it's worth now |
| 28 Nov 2025 | £101,250 |
| 22 Mar 2019 | £82,500 |
32, Meadowcroft Cottages, Meadow Croft Lane, Windermere LA23 3JE
| Today | See what it's worth now |
| 27 Nov 2025 | £325,000 |
| 2 Jul 1998 | £87,500 |
No other historical records.
32a, Beechwood Close, Bowness-on-windermere LA23 3AB
| Today | See what it's worth now |
| 10 Nov 2025 | £175,000 |
No other historical records.
The Brambles, Meadow Croft Lane, Windermere LA23 3JJ
| Today | See what it's worth now |
| 27 Oct 2025 | £1,075,000 |
| 8 Apr 2024 | £485,000 |
Pine Ridge, Crook Road, Windermere LA23 3NE
| Today | See what it's worth now |
| 7 Oct 2025 | £1,072,000 |
| 21 Jan 2009 | £499,000 |
No other historical records.
7, Windward Way, The Marina, Windermere LA23 3BF
| Today | See what it's worth now |
| 10 Sep 2025 | £580,000 |
| 15 Jan 2020 | £475,000 |
3, Meadowcroft Cottages, Meadow Croft Lane, Windermere LA23 3JE
| Today | See what it's worth now |
| 1 Sep 2025 | £490,000 |
| 19 Jan 2007 | £260,000 |
No other historical records.
1, Langrigge Cottage, Langrigge Drive, Bowness-on-windermere LA23 3AQ
| Today | See what it's worth now |
| 18 Aug 2025 | £450,000 |
No other historical records.
4, Fir Tree Crescent, Windermere LA23 3HA

| Today | See what it's worth now |
| 20 Jun 2025 | £589,500 |
| 5 Dec 2012 | £200,000 |
Holme Mead, Storrs Park, Windermere LA23 3LT
| Today | See what it's worth now |
| 20 Jun 2025 | £1,875,000 |
| 29 Sep 2005 | £1,300,000 |
No other historical records.
29a, Quarry Rigg, Windermere LA23 3DT
| Today | See what it's worth now |
| 12 Jun 2025 | £170,000 |
| 21 Jul 2017 | £127,000 |
1, Crown Rigg, Kendal Road, Windermere LA23 3EN

| Today | See what it's worth now |
| 11 Apr 2025 | £775,000 |
| 8 Dec 2023 | £725,000 |
19, Windward Way, The Marina, Windermere LA23 3BF
| Today | See what it's worth now |
| 31 Mar 2025 | £345,000 |
| 13 Jan 2017 | £405,000 |
Source Acknowledgement: © Crown copyright. England and Wales house price data is publicly available information produced by the HM Land Registry.This material was last updated on 9 July 2026. It covers the period from 1 January 1995 to 30 April 2026 and contains property transactions which have been registered during that period. Contains HM Land Registry data © Crown copyright and database right 2026. This data is licensed under the Open Government Licence v3.0.
Disclaimer: Rightmove.co.uk provides this HM Land Registry data "as is". The burden for fitness of the data relies completely with the user and is provided for informational purposes only. No warranty, express or implied, is given relating to the accuracy of content of the HM Land Registry data and Rightmove does not accept any liability for error or omission. If you have found an error with the data or need further information please contact HM Land Registry.
Permitted Use: Viewers of this Information are granted permission to access this Crown copyright material and to download it onto electronic, magnetic, optical or similar storage media provided that such activities are for private research, study or in-house use only. Any other use of the material requires the formal written permission of Land Registry which can be requested from us, and is subject to an additional licence and associated charge.
Rightmove takes no liability for your use of, or reliance on, Rightmove's Instant Valuation due to the limitations of our tracking tool listed here. Use of this tool is taken entirely at your own risk. All rights reserved.