
House Prices in Gilley Law
House prices in Gilley Law have an overall average of £190,859 over the last year.
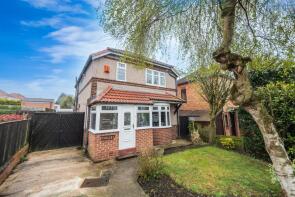
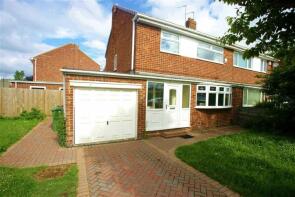
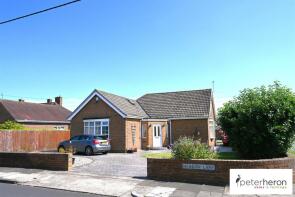
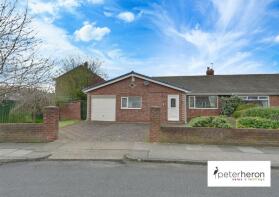
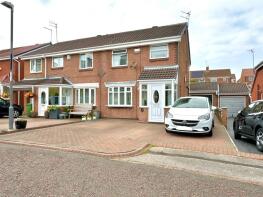
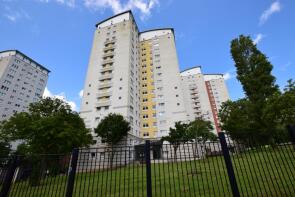
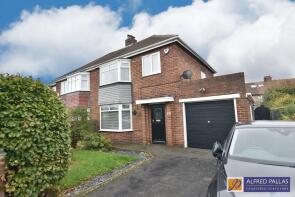
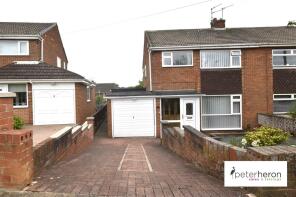
The majority of properties sold in Gilley Law during the last year were semi-detached properties, selling for an average price of £175,062. Detached properties sold for an average of £375,714, with flats fetching £49,000.
Overall, the historical sold prices in Gilley Law over the last year were 25% up on the previous year and 2% up on the 2021 peak of £186,976.
Properties Sold
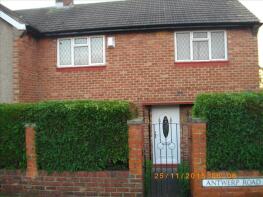
79, Antwerp Road, Sunderland SR3 3JH
| Today | See what it's worth now |
| 9 Jun 2025 | £125,000 |
| 25 Sep 2015 | £85,000 |
No other historical records.
30, Avonmouth Road, Sunderland SR3 3JA


| Today | See what it's worth now |
| 30 May 2025 | £95,000 |
| 17 Oct 2014 | £81,500 |
Tujays, Beaumaris Gardens, Sunderland SR3 3QJ
| Today | See what it's worth now |
| 16 May 2025 | £145,500 |
No other historical records.
2, Dunnlynn Close, Sunderland SR3 2SX
| Today | See what it's worth now |
| 7 May 2025 | £210,000 |
| 26 Apr 2023 | £215,000 |
No other historical records.
24, Beckwith Road, Sunderland SR3 3NE
| Today | See what it's worth now |
| 6 May 2025 | £205,000 |
No other historical records.
53, Aberdeen Tower, Amsterdam Road, Sunderland SR3 3AR
| Today | See what it's worth now |
| 2 May 2025 | £50,000 |
| 5 Jul 2024 | £55,000 |
33, Abercorn Road, Sunderland SR3 3LG
| Today | See what it's worth now |
| 2 May 2025 | £107,000 |
| 22 Jul 2005 | £73,000 |
1, Steep Hill, Sunderland SR3 3NP
| Today | See what it's worth now |
| 24 Apr 2025 | £595,000 |
| 7 Oct 2022 | £532,500 |
5, Clinton Place, Sunderland SR3 3SN
| Today | See what it's worth now |
| 17 Apr 2025 | £145,000 |
No other historical records.
45, Aboyne Square, Sunderland SR3 3LQ

| Today | See what it's worth now |
| 1 Apr 2025 | £152,000 |
| 3 Nov 2021 | £140,000 |
No other historical records.
19, Aydon House, Castles Green, Sunderland SR3 3HN

| Today | See what it's worth now |
| 31 Mar 2025 | £50,000 |
| 15 Aug 2016 | £45,000 |
No other historical records.
1, Farrington Avenue, Sunderland SR3 3LX
| Today | See what it's worth now |
| 28 Mar 2025 | £205,000 |
| 27 Aug 1997 | £67,500 |
No other historical records.
9, Raby Drive, Sunderland SR3 3QE
| Today | See what it's worth now |
| 28 Mar 2025 | £78,630 |
| 10 Mar 2017 | £145,000 |
2 Strathearn, Meadow Lane, Sunderland SR3 3RQ
| Today | See what it's worth now |
| 27 Mar 2025 | £410,000 |
| 2 Jun 2016 | £335,000 |
32, Launceston Drive, Sunderland SR3 3QD
| Today | See what it's worth now |
| 25 Mar 2025 | £190,000 |
| 22 Nov 1995 | £62,900 |
30, Knightsbridge, Sunderland SR3 3DP
| Today | See what it's worth now |
| 19 Mar 2025 | £168,500 |
No other historical records.
41, Amalfi Tower, Amsterdam Road, Sunderland SR3 3AN
| Today | See what it's worth now |
| 3 Mar 2025 | £47,000 |
| 8 Nov 2010 | £60,000 |
No other historical records.
64, Hillcrest, Sunderland SR3 3NN
| Today | See what it's worth now |
| 28 Feb 2025 | £290,000 |
| 26 Oct 2020 | £229,950 |
48, Carlton Crescent, Sunderland SR3 3PH
| Today | See what it's worth now |
| 21 Feb 2025 | £185,000 |
No other historical records.
Herrington Hall Cottages, Crow Lane, Sunderland SR3 3TE
| Today | See what it's worth now |
| 21 Feb 2025 | £230,000 |
| 27 Jan 2017 | £164,950 |
47, Clinton Place, Sunderland SR3 3SL
| Today | See what it's worth now |
| 17 Feb 2025 | £200,000 |
| 21 Jul 2017 | £100,000 |
No other historical records.
57, Carlton Crescent, Sunderland SR3 3PH
| Today | See what it's worth now |
| 14 Feb 2025 | £161,000 |
| 7 Jun 2001 | £65,000 |
37, Meadow View, Sunderland SR3 3RE
| Today | See what it's worth now |
| 3 Feb 2025 | £360,000 |
| 25 Feb 2022 | £355,000 |
54, Carlton Crescent, Sunderland SR3 3PH
| Today | See what it's worth now |
| 3 Feb 2025 | £298,000 |
| 26 May 2017 | £245,000 |
27, Knightsbridge, Sunderland SR3 3DP
| Today | See what it's worth now |
| 31 Jan 2025 | £152,500 |
| 22 Apr 2022 | £120,000 |
No other historical records.
Get ready with a Mortgage in Principle
- Personalised result in just 20 minutes
- Find out how much you can borrow
- Get viewings faster with agents
- No impact on your credit score
What's your property worth?
Source Acknowledgement: © Crown copyright. England and Wales house price data is publicly available information produced by the HM Land Registry.This material was last updated on 6 August 2025. It covers the period from 1 January 1995 to 30 June 2025 and contains property transactions which have been registered during that period. Contains HM Land Registry data © Crown copyright and database right 2025. This data is licensed under the Open Government Licence v3.0.
Disclaimer: Rightmove.co.uk provides this HM Land Registry data "as is". The burden for fitness of the data relies completely with the user and is provided for informational purposes only. No warranty, express or implied, is given relating to the accuracy of content of the HM Land Registry data and Rightmove does not accept any liability for error or omission. If you have found an error with the data or need further information please contact HM Land Registry.
Permitted Use: Viewers of this Information are granted permission to access this Crown copyright material and to download it onto electronic, magnetic, optical or similar storage media provided that such activities are for private research, study or in-house use only. Any other use of the material requires the formal written permission of Land Registry which can be requested from us, and is subject to an additional licence and associated charge.
Map data ©OpenStreetMap contributors.
Rightmove takes no liability for your use of, or reliance on, Rightmove's Instant Valuation due to the limitations of our tracking tool listed here. Use of this tool is taken entirely at your own risk. All rights reserved.