
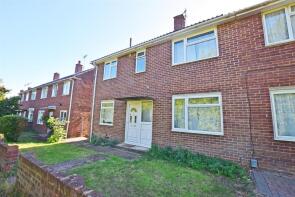
House Prices in Gillingham
House prices in Gillingham have an overall average of £329,615 over the last year.
The majority of properties sold in Gillingham during the last year were terraced properties, selling for an average price of £282,210. Semi-detached properties sold for an average of £359,104, with detached properties fetching £505,374.
Overall, the historical sold prices in Gillingham over the last year were similar to the previous year and 2% up on the 2022 peak of £323,545.
Properties Sold
17, Sandown Drive, Rainham, Gillingham ME8 9DT

| Today | See what it's worth now |
| 24 Apr 2026 | £430,000 |
| 23 Aug 2024 | £350,000 |
No other historical records.
18, Preston Way, Twydall, Gillingham ME8 6UP
| Today | See what it's worth now |
| 24 Apr 2026 | £290,000 |
| 14 Jul 2005 | £127,500 |
No other historical records.
9, The Everglades, Hempstead, Gillingham ME7 3PY
| Today | See what it's worth now |
| 24 Apr 2026 | £375,000 |
| 16 Aug 2001 | £138,000 |
No other historical records.
66, Kingswood Road, Gillingham ME7 1DX
| Today | See what it's worth now |
| 23 Apr 2026 | £275,000 |
| 12 Jan 1996 | £38,875 |
No other historical records.
17, Chalky Bank Road, Rainham, Gillingham ME8 7NN
| Today | See what it's worth now |
| 20 Apr 2026 | £410,000 |
| 9 Sep 2019 | £345,000 |
36, East Street, Gillingham ME7 1EH
| Today | See what it's worth now |
| 17 Apr 2026 | £245,000 |
| 5 Aug 2016 | £180,000 |
No other historical records.
Flat 35, The Eye, Barrier Road, Chatham ME4 4SD
| Today | See what it's worth now |
| 17 Apr 2026 | £200,000 |
| 30 Jun 2016 | £188,000 |
95, Edwin Road, Rainham, Gillingham ME8 0AE
| Today | See what it's worth now |
| 17 Apr 2026 | £499,950 |
| 15 Jul 2022 | £425,000 |
No other historical records.
39, Allington Road, Gillingham ME8 6PD
| Today | See what it's worth now |
| 16 Apr 2026 | £360,000 |
| 1 Jun 2007 | £161,000 |
No other historical records.
19, Leeds Square, Twydall, Gillingham ME8 6LH
| Today | See what it's worth now |
| 15 Apr 2026 | £255,000 |
| 21 Feb 2020 | £210,000 |
No other historical records.
12, Northumberland Avenue, Rainham, Gillingham ME8 7JZ
| Today | See what it's worth now |
| 15 Apr 2026 | £428,000 |
| 9 Nov 2001 | £128,000 |
52, Castlemaine Avenue, Gillingham ME7 2QE
| Today | See what it's worth now |
| 15 Apr 2026 | £342,000 |
| 31 May 1995 | £56,500 |
No other historical records.
11, Pine Grove, Hempstead, Gillingham ME7 3QR
| Today | See what it's worth now |
| 13 Apr 2026 | £343,600 |
| 13 Jul 2020 | £290,000 |
121, Waterside Lane, Gillingham ME7 2ST
| Today | See what it's worth now |
| 13 Apr 2026 | £375,000 |
| 4 Feb 2019 | £300,000 |
681, Lower Rainham Road, Rainham, Gillingham ME8 7TY
| Today | See what it's worth now |
| 10 Apr 2026 | £345,000 |
| 23 Aug 2013 | £185,000 |
131, Albany Road, Gillingham ME7 4HW
| Today | See what it's worth now |
| 10 Apr 2026 | £195,000 |
| 11 Mar 1998 | £34,500 |
No other historical records.
36, West Street, Gillingham ME7 1EF
| Today | See what it's worth now |
| 9 Apr 2026 | £230,000 |
| 14 Dec 2011 | £82,000 |
26, Childscroft Road, Rainham, Gillingham ME8 7SS
| Today | See what it's worth now |
| 8 Apr 2026 | £350,000 |
| 25 Apr 2007 | £215,000 |
No other historical records.
44, Stafford Street, Gillingham ME7 5EN
| Today | See what it's worth now |
| 8 Apr 2026 | £245,000 |
No other historical records.
72, Patrixbourne Avenue, Twydall, Gillingham ME8 6TZ
| Today | See what it's worth now |
| 7 Apr 2026 | £317,000 |
| 27 Aug 2015 | £175,000 |
No other historical records.
37, Malvern Road, Gillingham ME7 4BA
| Today | See what it's worth now |
| 7 Apr 2026 | £420,000 |
| 6 Nov 2006 | £217,000 |
No other historical records.
321, Barnsole Road, Gillingham ME7 4JE

| Today | See what it's worth now |
| 2 Apr 2026 | £175,000 |
| 19 Oct 2016 | £233,000 |
No other historical records.
26, Pembury Way, Rainham, Gillingham ME8 7DL

| Today | See what it's worth now |
| 2 Apr 2026 | £358,000 |
No other historical records.

Source Acknowledgement: © Crown copyright. England and Wales house price data is publicly available information produced by the HM Land Registry.This material was last updated on 9 July 2026. It covers the period from 1 January 1995 to 30 April 2026 and contains property transactions which have been registered during that period. Contains HM Land Registry data © Crown copyright and database right 2026. This data is licensed under the Open Government Licence v3.0.
Disclaimer: Rightmove.co.uk provides this HM Land Registry data "as is". The burden for fitness of the data relies completely with the user and is provided for informational purposes only. No warranty, express or implied, is given relating to the accuracy of content of the HM Land Registry data and Rightmove does not accept any liability for error or omission. If you have found an error with the data or need further information please contact HM Land Registry.
Permitted Use: Viewers of this Information are granted permission to access this Crown copyright material and to download it onto electronic, magnetic, optical or similar storage media provided that such activities are for private research, study or in-house use only. Any other use of the material requires the formal written permission of Land Registry which can be requested from us, and is subject to an additional licence and associated charge.
Rightmove takes no liability for your use of, or reliance on, Rightmove's Instant Valuation due to the limitations of our tracking tool listed here. Use of this tool is taken entirely at your own risk. All rights reserved.