
House Prices in Gilwell Park
House prices in Gilwell Park have an overall average of £603,614 over the last year.
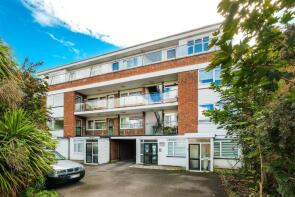
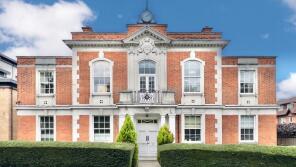
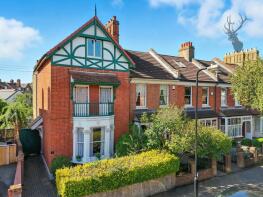
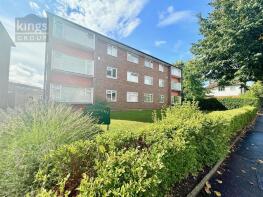
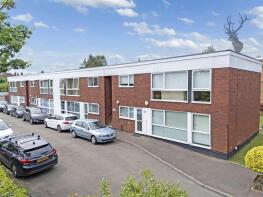
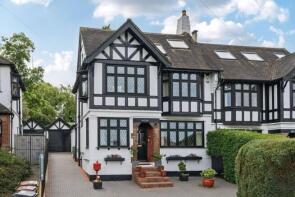
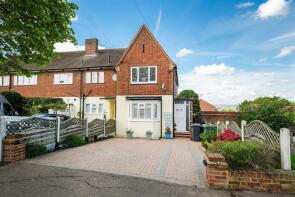
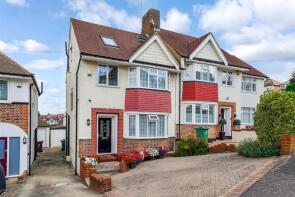
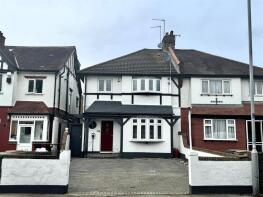
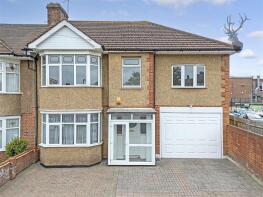
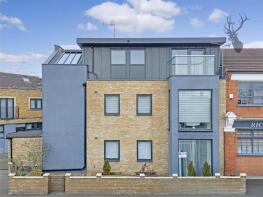
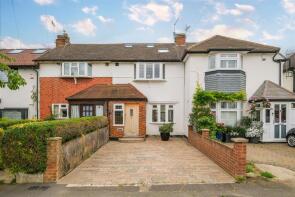
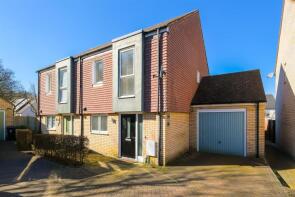
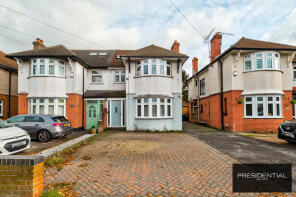
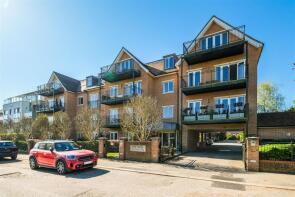
The majority of properties sold in Gilwell Park during the last year were terraced properties, selling for an average price of £646,693. Flats sold for an average of £399,220, with semi-detached properties fetching £661,206.
Overall, the historical sold prices in Gilwell Park over the last year were 7% up on the previous year and 1% down on the 2021 peak of £612,037.
Properties Sold
4, 23 Avon Court, The Ridgeway, London E4 6QY
| Today | See what it's worth now |
| 16 Apr 2026 | £340,000 |
| 23 Jul 2001 | £112,500 |
38, Scholars Road, London E4 7HH

| Today | See what it's worth now |
| 16 Apr 2026 | £640,000 |
| 25 Mar 2014 | £420,000 |
Flat 5, 16 Old Town Hall, The Ridgeway, London E4 6BF
| Today | See what it's worth now |
| 16 Apr 2026 | £467,000 |
| 25 Mar 2021 | £420,000 |
1, Buxton Road, Chingford E4 7DP
| Today | See what it's worth now |
| 27 Mar 2026 | £867,000 |
No other historical records.
3, 13 Connaught Court, Connaught Avenue, London E4 7AG
| Today | See what it's worth now |
| 20 Mar 2026 | £370,000 |
| 9 Feb 2018 | £342,500 |
3, Sunnyside Drive, Chingford E4 7DZ
| Today | See what it's worth now |
| 19 Mar 2026 | £600,000 |
No other historical records.
29, Queens Grove Road, London E4 7BT
| Today | See what it's worth now |
| 12 Mar 2026 | £775,000 |
| 26 May 2022 | £583,000 |
No other historical records.
6, 3 Pineview Court, The Ridgeway, London E4 6TL
| Today | See what it's worth now |
| 6 Mar 2026 | £385,000 |
| 23 Oct 2015 | £306,500 |
52, Woodland Road, Chingford E4 7EU
| Today | See what it's worth now |
| 20 Feb 2026 | £788,000 |
No other historical records.
13, 28 Doncel Court, Forest View, London E4 7AW
| Today | See what it's worth now |
| 19 Feb 2026 | £400,000 |
| 24 Apr 2018 | £325,000 |
43, Mount Echo Drive, London E4 7LA
| Today | See what it's worth now |
| 30 Jan 2026 | £868,540 |
| 15 Oct 2007 | £475,000 |
31, Mount Echo Avenue, London E4 7JX
| Today | See what it's worth now |
| 30 Jan 2026 | £490,000 |
| 28 Oct 2013 | £274,999 |
No other historical records.
18, Dove House Gardens, London E4 7SL
| Today | See what it's worth now |
| 30 Jan 2026 | £615,000 |
| 31 Jul 2001 | £184,000 |
No other historical records.
37, Larkshall Road, London E4 7HS
| Today | See what it's worth now |
| 29 Jan 2026 | £697,400 |
| 9 Sep 2016 | £590,000 |
No other historical records.
2, Richmond Road, Chingford E4 7BN
| Today | See what it's worth now |
| 29 Jan 2026 | £800,000 |
No other historical records.
Apartment 1, 12, Cart Lane, Chingford E4 7DH
| Today | See what it's worth now |
| 22 Jan 2026 | £435,000 |
| 26 Oct 2022 | £425,000 |
No other historical records.
9, Hawkdene, London E4 7PF
| Today | See what it's worth now |
| 22 Jan 2026 | £500,000 |
| 18 Apr 2006 | £206,000 |
7, Margaret Avenue, London E4 7NP
| Today | See what it's worth now |
| 16 Jan 2026 | £625,000 |
| 4 Nov 2005 | £267,500 |
No other historical records.
48a, Woodland Road, London E4 7EU
| Today | See what it's worth now |
| 9 Jan 2026 | £385,000 |
| 12 May 2000 | £107,500 |
55, Hungerdown, London E4 6QJ
| Today | See what it's worth now |
| 19 Dec 2025 | £310,000 |
| 22 Dec 2021 | £280,000 |
50, Queens Grove Road, London E4 7BT
| Today | See what it's worth now |
| 19 Dec 2025 | £632,500 |
| 14 Mar 2024 | £570,000 |
14, King George Way, London E4 7FN
| Today | See what it's worth now |
| 19 Dec 2025 | £440,000 |
| 23 Jul 2018 | £415,000 |
192, Sewardstone Road, Chingford E4 7QA
| Today | See what it's worth now |
| 19 Dec 2025 | £629,184 |
No other historical records.
Source Acknowledgement: © Crown copyright. England and Wales house price data is publicly available information produced by the HM Land Registry.This material was last updated on 9 July 2026. It covers the period from 1 January 1995 to 30 April 2026 and contains property transactions which have been registered during that period. Contains HM Land Registry data © Crown copyright and database right 2026. This data is licensed under the Open Government Licence v3.0.
Disclaimer: Rightmove.co.uk provides this HM Land Registry data "as is". The burden for fitness of the data relies completely with the user and is provided for informational purposes only. No warranty, express or implied, is given relating to the accuracy of content of the HM Land Registry data and Rightmove does not accept any liability for error or omission. If you have found an error with the data or need further information please contact HM Land Registry.
Permitted Use: Viewers of this Information are granted permission to access this Crown copyright material and to download it onto electronic, magnetic, optical or similar storage media provided that such activities are for private research, study or in-house use only. Any other use of the material requires the formal written permission of Land Registry which can be requested from us, and is subject to an additional licence and associated charge.
Rightmove takes no liability for your use of, or reliance on, Rightmove's Instant Valuation due to the limitations of our tracking tool listed here. Use of this tool is taken entirely at your own risk. All rights reserved.