
House Prices in Golch
House prices in Golch have an overall average of £181,369 over the last year.
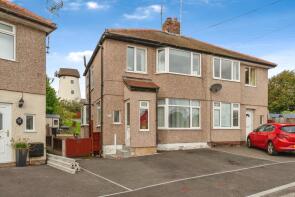
The majority of properties sold in Golch during the last year were semi-detached properties, selling for an average price of £162,837. Detached properties sold for an average of £281,104, with terraced properties fetching £123,200.
Overall, the historical sold prices in Golch over the last year were 4% up on the previous year and 10% up on the 2022 peak of £165,511.
Properties Sold
2, Cairnton Crescent, Holywell CH8 7EX
| Today | See what it's worth now |
| 8 Apr 2026 | £170,000 |
| 18 Apr 2012 | £125,000 |
2, Tudor Villas, Whitford Street, Holywell CH8 7NF
| Today | See what it's worth now |
| 7 Apr 2026 | £190,750 |
| 25 Feb 2016 | £60,000 |
No other historical records.
7 Silverdene, Hillside Court, Holywell CH8 7PJ

| Today | See what it's worth now |
| 30 Mar 2026 | £217,000 |
| 19 Dec 2022 | £185,000 |
3, Ffordd Y Faenol Fach, Holywell CH8 7LG
| Today | See what it's worth now |
| 20 Mar 2026 | £382,000 |
| 11 May 2018 | £295,000 |
No other historical records.
8, Bryn Y Gwynt, Holywell CH8 7BX
| Today | See what it's worth now |
| 20 Mar 2026 | £110,000 |
| 21 Nov 2005 | £87,500 |
No other historical records.
14, Pen Y Maes Gardens, Holywell CH8 7BL
| Today | See what it's worth now |
| 19 Mar 2026 | £177,000 |
| 20 Aug 2021 | £135,000 |
No other historical records.
21, Dewi Avenue, Holywell CH8 7UG

| Today | See what it's worth now |
| 9 Mar 2026 | £135,000 |
| 24 Sep 2021 | £118,000 |
5, Park Lane, Holywell CH8 7UR

| Today | See what it's worth now |
| 6 Mar 2026 | £130,000 |
| 16 May 2014 | £90,000 |
5 Flat 5, Cae Mefus, Pen Y Ball Street, Holywell CH8 7LU

| Today | See what it's worth now |
| 6 Mar 2026 | £63,000 |
| 17 Aug 2018 | £52,500 |
No other historical records.
1, Peniel Villas, Bagillt Road, Holywell CH8 7EY
| Today | See what it's worth now |
| 23 Feb 2026 | £133,000 |
| 1 Nov 2016 | £97,500 |
4, Jenard Court, Holywell CH8 7SL
| Today | See what it's worth now |
| 23 Feb 2026 | £90,000 |
No other historical records.
41, Glan Y Don, Holywell CH8 7HQ

| Today | See what it's worth now |
| 6 Feb 2026 | £117,000 |
| 14 Apr 2022 | £120,000 |
16, Delyn Road, Holywell CH8 7JD
| Today | See what it's worth now |
| 23 Jan 2026 | £162,500 |
| 23 Apr 2020 | £90,000 |
No other historical records.
32, Coleshill Street, Holywell CH8 7UP
| Today | See what it's worth now |
| 16 Jan 2026 | £175,000 |
| 14 Jun 1996 | £34,000 |
No other historical records.
6, Bryn Afon, Holywell CH8 7PW
| Today | See what it's worth now |
| 9 Jan 2026 | £118,000 |
| 10 Feb 2006 | £105,000 |
8, Sealand Avenue, Holywell CH8 7BU
| Today | See what it's worth now |
| 5 Jan 2026 | £175,000 |
| 18 Nov 2002 | £59,900 |
No other historical records.
10 Vardre, Bryn Aber, Holywell CH8 7NZ

| Today | See what it's worth now |
| 19 Dec 2025 | £320,000 |
| 2 Sep 2005 | £245,000 |
No other historical records.
12b Odyssey, Bryn Aber, Holywell CH8 7NZ

| Today | See what it's worth now |
| 19 Dec 2025 | £197,250 |
| 16 Feb 2006 | £174,950 |
No other historical records.
89, Pen Y Maes Gardens, Holywell CH8 7BW
| Today | See what it's worth now |
| 12 Dec 2025 | £175,000 |
| 2 Nov 2007 | £85,000 |
No other historical records.
3, Lluesty Place, Old Chester Road, Milwr CH8 7SQ
| Today | See what it's worth now |
| 12 Dec 2025 | £126,000 |
| 4 May 2023 | £147,500 |
No other historical records.
76, Woodland Drive, Greenfield CH8 7HZ
| Today | See what it's worth now |
| 12 Dec 2025 | £140,000 |
No other historical records.
31, Rose Hill, Holywell CH8 7TL
| Today | See what it's worth now |
| 8 Dec 2025 | £260,000 |
| 30 Jun 2006 | £163,000 |
No other historical records.
Springhill House, Ffordd Brynffynnon, Holywell CH8 7EH
| Today | See what it's worth now |
| 28 Nov 2025 | £383,750 |
| 14 Aug 2020 | £330,000 |
Source Acknowledgement: © Crown copyright. England and Wales house price data is publicly available information produced by the HM Land Registry.This material was last updated on 9 July 2026. It covers the period from 1 January 1995 to 30 April 2026 and contains property transactions which have been registered during that period. Contains HM Land Registry data © Crown copyright and database right 2026. This data is licensed under the Open Government Licence v3.0.
Disclaimer: Rightmove.co.uk provides this HM Land Registry data "as is". The burden for fitness of the data relies completely with the user and is provided for informational purposes only. No warranty, express or implied, is given relating to the accuracy of content of the HM Land Registry data and Rightmove does not accept any liability for error or omission. If you have found an error with the data or need further information please contact HM Land Registry.
Permitted Use: Viewers of this Information are granted permission to access this Crown copyright material and to download it onto electronic, magnetic, optical or similar storage media provided that such activities are for private research, study or in-house use only. Any other use of the material requires the formal written permission of Land Registry which can be requested from us, and is subject to an additional licence and associated charge.
Rightmove takes no liability for your use of, or reliance on, Rightmove's Instant Valuation due to the limitations of our tracking tool listed here. Use of this tool is taken entirely at your own risk. All rights reserved.