
House Prices in Grasby
House prices in Grasby have an overall average of £297,700 over the last year.
The majority of properties sold in Grasby during the last year were detached properties, selling for an average price of £339,000. Terraced properties sold for an average of £132,500.
Overall, the historical sold prices in Grasby over the last year were 18% down on the previous year and 26% down on the 2022 peak of £402,600.
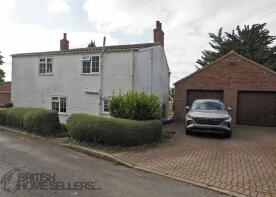
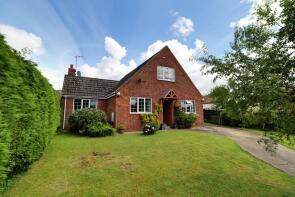
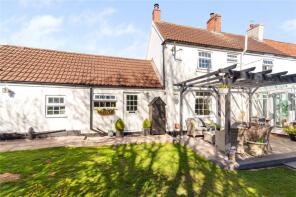
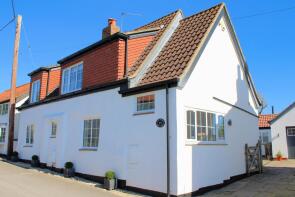
Properties Sold
10 White House, Clixby Lane, Grasby, Barnetby DN38 6AJ
| Today | See what it's worth now |
| 30 Jan 2026 | £365,000 |
| 5 Jul 2000 | £125,000 |
No other historical records.
1 Braemar, Canty Nook, Grasby, Barnetby DN38 6BP
| Today | See what it's worth now |
| 20 Jan 2026 | £283,000 |
| 2 Jul 1999 | £82,500 |
No other historical records.
3 Courtyard Cottage, Vicarage Lane, Grasby, Barnetby DN38 6AU
| Today | See what it's worth now |
| 17 Dec 2025 | £308,000 |
| 3 Aug 2022 | £270,000 |
15 The Cottage, Front Street, Grasby, Barnetby DN38 6AN
| Today | See what it's worth now |
| 17 Sep 2025 | £400,000 |
| 29 May 2019 | £277,500 |
33, Station Road, Grasby, Barnetby DN38 6AP
| Today | See what it's worth now |
| 8 Sep 2025 | £132,500 |
| 25 Jul 2008 | £99,000 |
Netherwood, Station Road, Grasby, Barnetby DN38 6AP
| Today | See what it's worth now |
| 30 May 2025 | £345,500 |
No other historical records.
3, The Old Quarry, Grasby, Barnetby DN38 6BX
| Today | See what it's worth now |
| 31 Mar 2025 | £418,000 |
| 6 Oct 2006 | £249,950 |
No other historical records.
Mill Farm Garden, Mill Farm, Brigg Road, Grasby, Barnetby DN38 6AQ
| Today | See what it's worth now |
| 13 Feb 2025 | £560,000 |
| 19 Apr 2002 | £120,000 |
No other historical records.
22, Station Road, Grasby, Barnetby DN38 6AP
| Today | See what it's worth now |
| 28 Oct 2024 | £400,000 |
| 12 Aug 2015 | £242,000 |
No other historical records.
11, Front Street, Grasby, Barnetby DN38 6AN
| Today | See what it's worth now |
| 28 Oct 2024 | £385,000 |
No other historical records.
19, Station Road, Grasby, Barnetby DN38 6AP

| Today | See what it's worth now |
| 4 Oct 2024 | £190,000 |
| 20 Sep 2022 | £210,000 |
23 Berkley House, Station Road, Grasby, Barnetby DN38 6AP
| Today | See what it's worth now |
| 4 Oct 2024 | £435,000 |
| 11 Jan 2008 | £245,000 |
No other historical records.
16, Bentley Lane, Grasby, Barnetby DN38 6AW

| Today | See what it's worth now |
| 19 Jul 2024 | £160,000 |
No other historical records.
9, Clixby Lane, Grasby, Barnetby DN38 6AJ
| Today | See what it's worth now |
| 1 Mar 2024 | £175,000 |
| 31 Aug 2017 | £145,000 |
18 The Pippins, Station Road, Grasby, Barnetby DN38 6AP
| Today | See what it's worth now |
| 28 Jul 2023 | £427,500 |
| 7 Dec 1998 | £100,000 |
No other historical records.
2, Brigg Road, Grasby, Barnetby DN38 6AX

| Today | See what it's worth now |
| 26 May 2023 | £210,000 |
| 23 Jan 2017 | £140,000 |
No other historical records.
12 Cherrymede, Station Road, Grasby, Barnetby DN38 6AP
| Today | See what it's worth now |
| 31 Mar 2023 | £264,000 |
No other historical records.
The Old Chapel, Main Street, Grasby, Barnetby DN38 6AH

| Today | See what it's worth now |
| 21 Mar 2023 | £435,000 |
| 16 Dec 2005 | £225,000 |
14 Fox Cottage, Vicarage Lane, Grasby, Barnetby DN38 6AU

| Today | See what it's worth now |
| 17 Oct 2022 | £410,000 |
No other historical records.
1, Vicarage Lane, Grasby, Barnetby DN38 6AU
| Today | See what it's worth now |
| 23 Sep 2022 | £310,000 |
| 14 Oct 2005 | £139,500 |
No other historical records.
20 Rudby House, Vicarage Lane, Grasby, Barnetby DN38 6AU
| Today | See what it's worth now |
| 7 Sep 2022 | £550,000 |
| 1 Dec 2006 | £280,000 |
No other historical records.
38, Vicarage Lane, Grasby, Barnetby DN38 6AU

| Today | See what it's worth now |
| 7 Sep 2022 | £460,000 |
| 13 Oct 2015 | £355,000 |
Dovecote House, Vicarage Lane, Grasby, Barnetby DN38 6AU
| Today | See what it's worth now |
| 18 Aug 2022 | £525,000 |
| 5 Aug 2016 | £340,000 |


Source Acknowledgement: © Crown copyright. England and Wales house price data is publicly available information produced by the HM Land Registry.This material was last updated on 9 July 2026. It covers the period from 1 January 1995 to 30 April 2026 and contains property transactions which have been registered during that period. Contains HM Land Registry data © Crown copyright and database right 2026. This data is licensed under the Open Government Licence v3.0.
Disclaimer: Rightmove.co.uk provides this HM Land Registry data "as is". The burden for fitness of the data relies completely with the user and is provided for informational purposes only. No warranty, express or implied, is given relating to the accuracy of content of the HM Land Registry data and Rightmove does not accept any liability for error or omission. If you have found an error with the data or need further information please contact HM Land Registry.
Permitted Use: Viewers of this Information are granted permission to access this Crown copyright material and to download it onto electronic, magnetic, optical or similar storage media provided that such activities are for private research, study or in-house use only. Any other use of the material requires the formal written permission of Land Registry which can be requested from us, and is subject to an additional licence and associated charge.
Rightmove takes no liability for your use of, or reliance on, Rightmove's Instant Valuation due to the limitations of our tracking tool listed here. Use of this tool is taken entirely at your own risk. All rights reserved.