
House Prices in Greasby
House prices in Greasby have an overall average of £285,853 over the last year.
The majority of properties sold in Greasby during the last year were semi-detached properties, selling for an average price of £268,584. Detached properties sold for an average of £359,192, with flats fetching £126,667.
Overall, the historical sold prices in Greasby over the last year were 3% up on the previous year and 3% up on the 2022 peak of £278,306.
Properties Sold
4, Lombardy Avenue, Wirral CH49 3AE
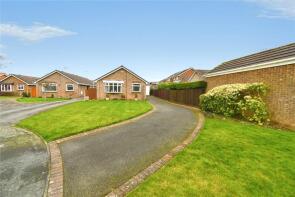
| Today | See today's value |
| 17 Aug 2026 | £378,000 |
| 9 May 2022 | £378,000 |
14, Summertrees Close, Greasby CH49 2SD
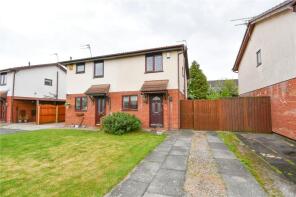
| Today | See today's value |
| 14 Aug 2026 | £180,000 |
No other historical records.
5 Sheraton, Coppice Grove, Wirral CH49 3GX
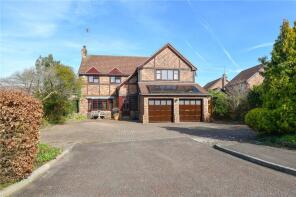
| Today | See today's value |
| 4 Aug 2026 | £600,000 |
| 2 May 2002 | £240,000 |
12, Eastway, Wirral CH49 2NT

| Today | See today's value |
| 4 Aug 2026 | £300,000 |
| 22 Feb 2018 | £225,000 |
No other historical records.
10, Stable Close, Wirral CH49 2RW
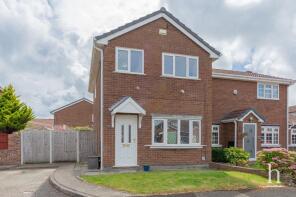
| Today | See today's value |
| 3 Aug 2026 | £225,000 |
| 12 Feb 2015 | £152,500 |
37, Hall Drive, Wirral CH49 1RW
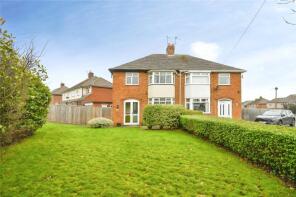
| Today | See today's value |
| 31 Jul 2026 | £250,000 |
| 2 Jan 2020 | £225,000 |
17, Fuchsia Walk, Wirral CH49 3AG
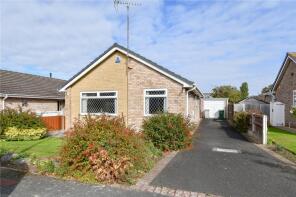
| Today | See today's value |
| 28 Jul 2026 | £349,000 |
| 5 Apr 2004 | £184,950 |
No other historical records.
307 Wethersfield, Frankby Road, Wirral CH49 3PE
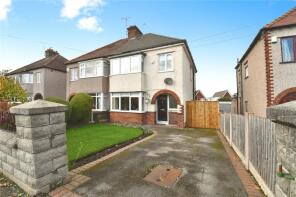
| Today | See today's value |
| 27 Jul 2026 | £305,000 |
| 30 Sep 2021 | £260,500 |
3, Tunstall Close, Wirral CH49 6PD
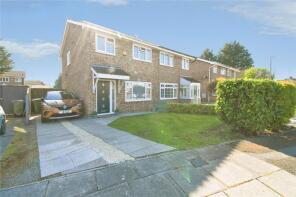
| Today | See today's value |
| 20 Jul 2026 | £253,000 |
| 3 Feb 2025 | £233,000 |
16, The Crofters, Wirral CH49 2RP

| Today | See today's value |
| 17 Jul 2026 | £91,087 |
| 12 Jun 2013 | £125,000 |
No other historical records.
7, The Scythes, Wirral CH49 2RL
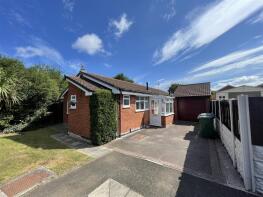
| Today | See today's value |
| 17 Jul 2026 | £308,000 |
| 4 Apr 1995 | £55,000 |
No other historical records.
14, Ashdale Park, Wirral CH49 3GT
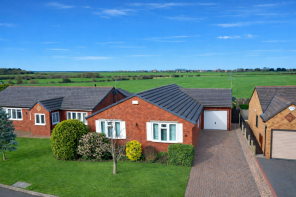
| Today | See today's value |
| 8 Jul 2026 | £375,000 |
| 14 Jul 2014 | £269,950 |
39, Summertrees Avenue, Wirral CH49 2QD
| Today | See today's value |
| 3 Jul 2026 | £250,000 |
| 17 Aug 2017 | £171,000 |
10, Thorns Drive, Wirral CH49 3PU
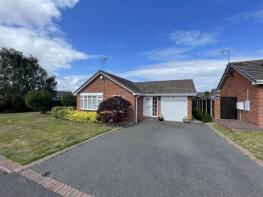
| Today | See today's value |
| 3 Jul 2026 | £379,500 |
| 6 Jul 2007 | £292,500 |
No other historical records.
19, Locker Park, Wirral CH49 2RZ
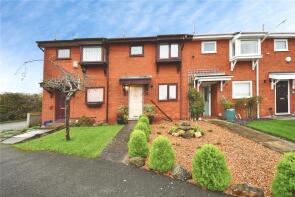
| Today | See today's value |
| 29 Jun 2026 | £194,000 |
| 23 Jul 1999 | £45,400 |
24, Bromsgrove Road, Wirral CH49 2QN
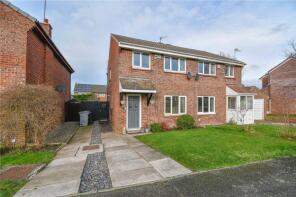
| Today | See today's value |
| 26 Jun 2026 | £250,000 |
| 1 Sep 2023 | £210,000 |
85, Mill Lane, Wirral CH49 3NS
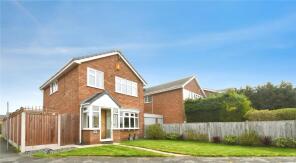
| Today | See today's value |
| 22 Jun 2026 | £347,000 |
| 17 Aug 2018 | £215,000 |
No other historical records.
80, Dingwall Drive, Greasby CH49 1SQ
| Today | See today's value |
| 19 Jun 2026 | £260,000 |
No other historical records.
5, Parr Grove, Wirral CH49 2RX
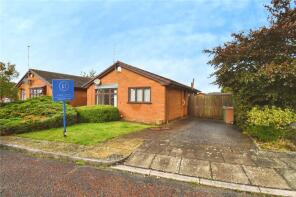
| Today | See today's value |
| 19 Jun 2026 | £230,000 |
| 17 Aug 2009 | £155,000 |
No other historical records.
10, The Croft, Wirral CH49 1SA

| Today | See today's value |
| 17 Jun 2026 | £325,000 |
| 28 Feb 2006 | £176,500 |
No other historical records.
315, Frankby Road, Wirral CH49 3PE
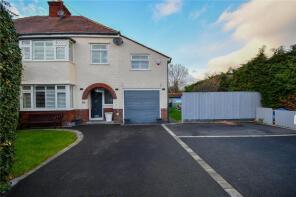
| Today | See today's value |
| 15 Jun 2026 | £380,000 |
| 1 Aug 2003 | £178,000 |
No other historical records.
5, The Barncroft, Wirral CH49 2SW
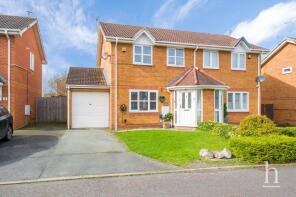
| Today | See today's value |
| 12 Jun 2026 | £265,500 |
| 16 Feb 2018 | £182,500 |
14, Cedarwood Close, Wirral CH49 3GU

| Today | See today's value |
| 11 Jun 2026 | £105,000 |
| 5 Jul 2000 | £33,000 |
No other historical records.

Rightmove takes no liability for your use of, or reliance on, Rightmove's Instant Valuation due to the limitations of our tracking tool listed here. Use of this tool is taken entirely at your own risk. All rights reserved.