
House Prices in GU20
House prices in GU20 have an overall average of £858,386 over the last year.
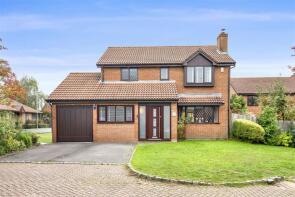
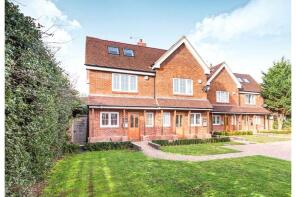
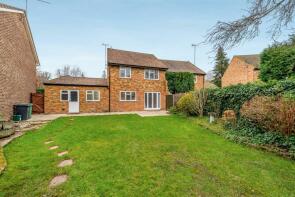
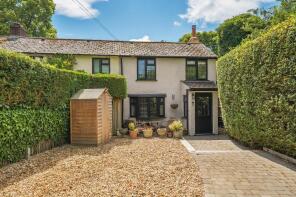
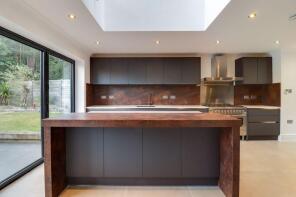
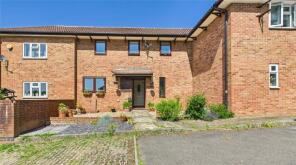
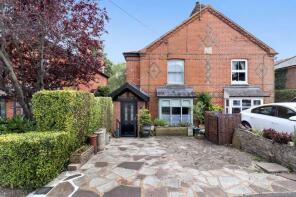
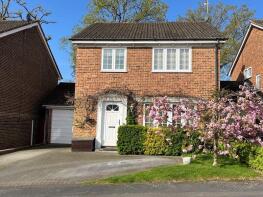
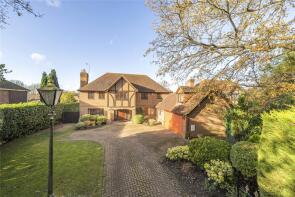
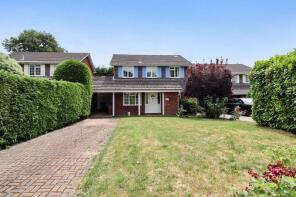
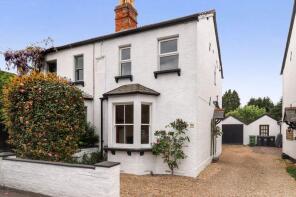
The majority of properties sold in GU20 during the last year were detached properties, selling for an average price of £1,089,727. Semi-detached properties sold for an average of £602,604, with terraced properties fetching £445,625.
Overall, the historical sold prices in GU20 over the last year were 13% up on the previous year and 1% up on the 2021 peak of £847,599.
Properties Sold
2, Owen Road, Windlesham GU20 6JG
| Today | See what it's worth now |
| 17 Apr 2026 | £799,950 |
| 30 Apr 2024 | £635,000 |
12, Ramsay Road, Windlesham GU20 6HS
| Today | See what it's worth now |
| 17 Mar 2026 | £670,000 |
| 8 Nov 2006 | £385,000 |
No other historical records.
7, Heathpark Drive, Windlesham GU20 6JA
| Today | See what it's worth now |
| 3 Mar 2026 | £900,000 |
| 26 Jul 2024 | £655,000 |
No other historical records.
Extensions and planning permission in GU20
See planning approval stats, extension build costs and value added estimates.

1, Moor Place, Windlesham GU20 6JS
| Today | See what it's worth now |
| 2 Mar 2026 | £1,025,000 |
| 17 Apr 2023 | £990,000 |
No other historical records.
5, Hatch End, Windlesham GU20 6QB
| Today | See what it's worth now |
| 26 Feb 2026 | £745,000 |
| 9 Mar 2001 | £283,000 |
1, Graffham Court, Thorndown Lane, Windlesham GU20 6DQ
| Today | See what it's worth now |
| 4 Feb 2026 | £500,000 |
| 18 Dec 2013 | £425,000 |
No other historical records.
1, Chewter Lane, Windlesham GU20 6JP
| Today | See what it's worth now |
| 30 Jan 2026 | £635,000 |
| 3 Oct 1997 | £175,000 |
No other historical records.
Daniella Cottage, Broadway Road, Windlesham GU20 6BU
| Today | See what it's worth now |
| 29 Jan 2026 | £565,000 |
| 30 Nov 2015 | £410,000 |
9, Ramsay Road, Windlesham GU20 6HS

| Today | See what it's worth now |
| 28 Jan 2026 | £635,000 |
| 15 Oct 2004 | £315,000 |
No other historical records.
1, Heathpark Drive, Windlesham GU20 6JA
| Today | See what it's worth now |
| 27 Jan 2026 | £830,000 |
| 18 Jul 2016 | £600,000 |
Timbers, Church Road, Windlesham GU20 6BH

| Today | See what it's worth now |
| 19 Jan 2026 | £499,999 |
No other historical records.
6, Hutton Close, Windlesham GU20 6DN
| Today | See what it's worth now |
| 19 Dec 2025 | £390,000 |
| 28 Jun 2022 | £380,000 |
60, Chertsey Road, Windlesham GU20 6HP
| Today | See what it's worth now |
| 8 Dec 2025 | £570,000 |
| 30 Jul 2010 | £302,500 |
No other historical records.
27, Bosman Drive, Windlesham GU20 6JN
| Today | See what it's worth now |
| 3 Dec 2025 | £655,000 |
| 29 Aug 2014 | £515,000 |
91 Bay Tree Cottage, Chertsey Road, Windlesham GU20 6HU
| Today | See what it's worth now |
| 1 Dec 2025 | £625,000 |
| 13 Feb 2008 | £440,000 |
The Wedge, Church Road, Windlesham GU20 6BH

| Today | See what it's worth now |
| 27 Nov 2025 | £425,000 |
No other historical records.
20, Deans Court, Windlesham GU20 6QE
| Today | See what it's worth now |
| 25 Nov 2025 | £395,000 |
| 9 Mar 2005 | £205,000 |
Copperfields, Westwood Road, Windlesham GU20 6LX
| Today | See what it's worth now |
| 11 Nov 2025 | £3,900,000 |
No other historical records.
22, Kings Lane, Windlesham GU20 6JQ
| Today | See what it's worth now |
| 7 Nov 2025 | £840,000 |
| 5 Oct 2017 | £705,000 |
No other historical records.
29, Windle Close, Windlesham GU20 6DZ
| Today | See what it's worth now |
| 7 Nov 2025 | £460,000 |
No other historical records.
Avening, Snows Ride, Windlesham GU20 6LA
| Today | See what it's worth now |
| 24 Oct 2025 | £1,400,000 |
| 16 May 2003 | £800,000 |
10, Atfield Grove, Windlesham GU20 6DP
| Today | See what it's worth now |
| 13 Oct 2025 | £666,000 |
No other historical records.
73, Heathpark Drive, Windlesham GU20 6AR
| Today | See what it's worth now |
| 10 Oct 2025 | £665,000 |
No other historical records.
Source Acknowledgement: © Crown copyright. England and Wales house price data is publicly available information produced by the HM Land Registry.This material was last updated on 9 July 2026. It covers the period from 1 January 1995 to 30 April 2026 and contains property transactions which have been registered during that period. Contains HM Land Registry data © Crown copyright and database right 2026. This data is licensed under the Open Government Licence v3.0.
Disclaimer: Rightmove.co.uk provides this HM Land Registry data "as is". The burden for fitness of the data relies completely with the user and is provided for informational purposes only. No warranty, express or implied, is given relating to the accuracy of content of the HM Land Registry data and Rightmove does not accept any liability for error or omission. If you have found an error with the data or need further information please contact HM Land Registry.
Permitted Use: Viewers of this Information are granted permission to access this Crown copyright material and to download it onto electronic, magnetic, optical or similar storage media provided that such activities are for private research, study or in-house use only. Any other use of the material requires the formal written permission of Land Registry which can be requested from us, and is subject to an additional licence and associated charge.
Rightmove takes no liability for your use of, or reliance on, Rightmove's Instant Valuation due to the limitations of our tracking tool listed here. Use of this tool is taken entirely at your own risk. All rights reserved.