
House Prices in Guidepost
House prices in Guidepost have an overall average of £136,103 over the last year.
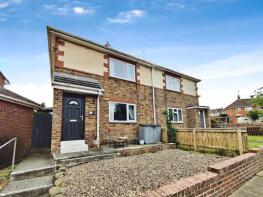
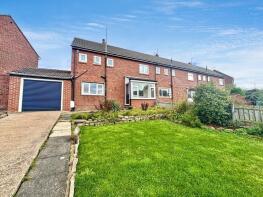
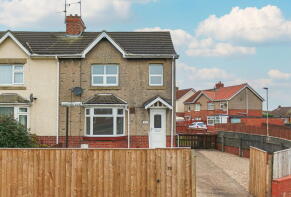
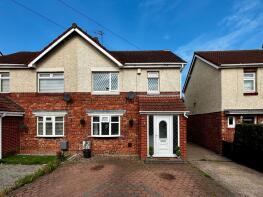
The majority of properties sold in Guidepost during the last year were semi-detached properties, selling for an average price of £139,824. Terraced properties sold for an average of £96,571, with detached properties fetching £210,375.
Overall, the historical sold prices in Guidepost over the last year were 2% down on the previous year and 9% down on the 2023 peak of £150,371.
Properties Sold
14, Meadowbank Drive, The Pastures, Choppington NE62 5YZ
| Today | See what it's worth now |
| 17 Apr 2026 | £105,000 |
| 30 Jan 2013 | £94,950 |
53, Welbeck Road, Choppington NE62 5PB
| Today | See what it's worth now |
| 20 Feb 2026 | £87,500 |
| 13 Jul 2021 | £67,000 |
64, Cleaswell Hill, Choppington NE62 5DZ
| Today | See what it's worth now |
| 1 Jan 2026 | £150,000 |
| 23 Dec 2022 | £110,000 |
28, Sheepwash Bank, Choppington NE62 5LX
| Today | See what it's worth now |
| 17 Dec 2025 | £105,000 |
| 9 Jan 2012 | £64,000 |
34, Sheepwash Avenue, Choppington NE62 5NN
| Today | See what it's worth now |
| 16 Dec 2025 | £105,000 |
| 22 Dec 2015 | £79,950 |
2, Olympia Avenue, Choppington NE62 5DS
| Today | See what it's worth now |
| 12 Dec 2025 | £125,000 |
| 13 Dec 2022 | £128,000 |
No other historical records.
63, Coleridge Drive, Sherbourne Park, Choppington NE62 5HD
| Today | See what it's worth now |
| 28 Nov 2025 | £207,000 |
| 26 Apr 1996 | £55,950 |
No other historical records.
5, Gladewell Court, The Pastures, Choppington NE62 5YY
| Today | See what it's worth now |
| 28 Nov 2025 | £220,000 |
| 6 Oct 2015 | £115,000 |
38, Hillcrest Avenue, Choppington NE62 5ED
| Today | See what it's worth now |
| 14 Nov 2025 | £90,000 |
| 6 Jul 2007 | £109,950 |
No other historical records.
3, Freehold Avenue, Choppington NE62 5DQ
| Today | See what it's worth now |
| 14 Nov 2025 | £150,000 |
| 19 Dec 2018 | £75,100 |
No other historical records.
64, Welbeck Road, Choppington NE62 5PB
| Today | See what it's worth now |
| 14 Nov 2025 | £90,000 |
| 3 Dec 2010 | £57,000 |
No other historical records.
17, Greenfield Drive, The Pastures, Choppington NE62 5YX
| Today | See what it's worth now |
| 4 Nov 2025 | £220,000 |
| 29 Jan 2016 | £155,600 |
3, Axbridge Close, Sherbourne Park, Choppington NE62 5HB
| Today | See what it's worth now |
| 3 Nov 2025 | £177,500 |
| 20 Jul 2001 | £57,500 |
4, Crossway, Choppington NE62 5DR
| Today | See what it's worth now |
| 31 Oct 2025 | £145,000 |
| 30 Jun 2015 | £75,000 |
21, Front Street, Choppington NE62 5DE
| Today | See what it's worth now |
| 29 Oct 2025 | £52,500 |
| 17 Jan 2014 | £52,500 |
6, Sycamore Avenue, Choppington NE62 5NZ
| Today | See what it's worth now |
| 15 Oct 2025 | £90,000 |
| 16 Jan 2013 | £45,500 |
No other historical records.
24, Sheepwash Bank, Choppington NE62 5LX
| Today | See what it's worth now |
| 29 Sep 2025 | £105,000 |
| 15 Jan 2021 | £69,950 |
12, Louvain Terrace, Guide Post NE62 5QU
| Today | See what it's worth now |
| 29 Aug 2025 | £130,000 |
| 12 Jan 2024 | £123,200 |
No other historical records.
41, Olympia Avenue, Choppington NE62 5DU
| Today | See what it's worth now |
| 15 Aug 2025 | £139,000 |
| 14 Feb 2022 | £116,000 |
No other historical records.
5, North Avenue, Choppington NE62 5PD
| Today | See what it's worth now |
| 15 Aug 2025 | £116,000 |
| 2 Aug 2016 | £76,250 |
No other historical records.
30, Front Street, Choppington NE62 5LT
| Today | See what it's worth now |
| 7 Aug 2025 | £55,000 |
| 13 Dec 2006 | £89,950 |
8, Ford Terrace, Choppington NE62 5QX
| Today | See what it's worth now |
| 30 Jul 2025 | £54,000 |
| 2 Aug 2002 | £36,900 |
No other historical records.
11, North Avenue, Choppington NE62 5PD

| Today | See what it's worth now |
| 28 Jul 2025 | £92,500 |
| 29 Apr 1996 | £14,700 |
No other historical records.
Source Acknowledgement: © Crown copyright. England and Wales house price data is publicly available information produced by the HM Land Registry.This material was last updated on 9 July 2026. It covers the period from 1 January 1995 to 30 April 2026 and contains property transactions which have been registered during that period. Contains HM Land Registry data © Crown copyright and database right 2026. This data is licensed under the Open Government Licence v3.0.
Disclaimer: Rightmove.co.uk provides this HM Land Registry data "as is". The burden for fitness of the data relies completely with the user and is provided for informational purposes only. No warranty, express or implied, is given relating to the accuracy of content of the HM Land Registry data and Rightmove does not accept any liability for error or omission. If you have found an error with the data or need further information please contact HM Land Registry.
Permitted Use: Viewers of this Information are granted permission to access this Crown copyright material and to download it onto electronic, magnetic, optical or similar storage media provided that such activities are for private research, study or in-house use only. Any other use of the material requires the formal written permission of Land Registry which can be requested from us, and is subject to an additional licence and associated charge.
Rightmove takes no liability for your use of, or reliance on, Rightmove's Instant Valuation due to the limitations of our tracking tool listed here. Use of this tool is taken entirely at your own risk. All rights reserved.