
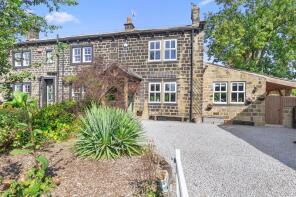
House Prices in Guiseley
House prices in Guiseley have an overall average of £349,036 over the last year.
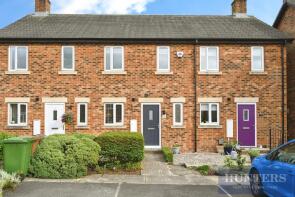
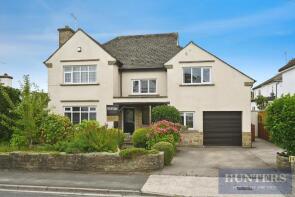
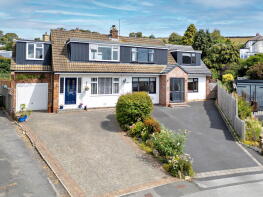
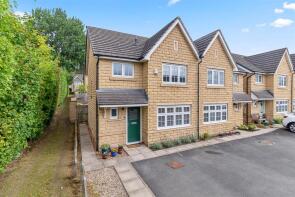
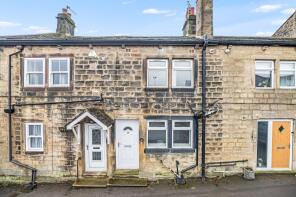
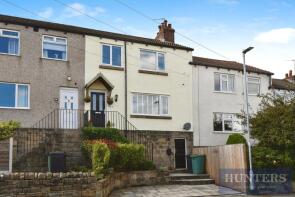
The majority of properties sold in Guiseley during the last year were terraced properties, selling for an average price of £287,204. Semi-detached properties sold for an average of £367,984, with detached properties fetching £606,000.
Overall, the historical sold prices in Guiseley over the last year were 2% down on the previous year and 2% up on the 2021 peak of £343,325.
Properties Sold
120, Otley Road, Guiseley, Leeds LS20 8LZ
| Today | See what it's worth now |
| 21 Apr 2026 | £455,000 |
| 11 Mar 2020 | £345,000 |
Red Gables, Renton Drive, Guiseley, Leeds LS20 8LW

| Today | See what it's worth now |
| 20 Apr 2026 | £600,000 |
| 29 Nov 2013 | £280,344 |
No other historical records.
6, Jacquard Gardens, Guiseley, Leeds LS20 9FP
| Today | See what it's worth now |
| 17 Apr 2026 | £475,000 |
| 18 Dec 2015 | £314,995 |
No other historical records.
83, Fieldhead Road, Guiseley, Leeds LS20 8DU
| Today | See what it's worth now |
| 9 Apr 2026 | £277,000 |
| 26 Sep 2014 | £180,050 |
15, Westgate, Guiseley, Leeds LS20 8HN
| Today | See what it's worth now |
| 27 Mar 2026 | £595,000 |
| 10 Feb 2003 | £242,000 |
51, Edison Way, Guiseley, Leeds LS20 9PX
| Today | See what it's worth now |
| 27 Mar 2026 | £240,000 |
| 18 Feb 2022 | £229,950 |
4, Tranfield Avenue, Guiseley, Leeds LS20 8NL
| Today | See what it's worth now |
| 27 Mar 2026 | £700,000 |
| 1 Aug 1997 | £131,000 |
No other historical records.
9, Shires Court, Shires Road, Guiseley, Leeds LS20 8EU
| Today | See what it's worth now |
| 25 Mar 2026 | £171,000 |
| 6 Jul 2007 | £160,000 |
No other historical records.
13, Nursery Road, Guiseley, Leeds LS20 9DQ
| Today | See what it's worth now |
| 20 Mar 2026 | £372,000 |
| 7 Dec 2012 | £158,000 |
No other historical records.
1, Shaw Villas, Queensway, Yeadon, Leeds LS20 9JG
| Today | See what it's worth now |
| 20 Mar 2026 | £433,000 |
| 11 Feb 2022 | £290,000 |
18, Back Lane, Guiseley, Leeds LS20 8EB
| Today | See what it's worth now |
| 6 Mar 2026 | £385,000 |
| 30 Aug 2006 | £245,000 |
27, Branwell Road, Guiseley, Leeds LS20 9FG
| Today | See what it's worth now |
| 6 Mar 2026 | £435,000 |
| 27 Jun 2013 | £265,455 |
No other historical records.
15, Wells Road, Guiseley, Leeds LS20 9AE
| Today | See what it's worth now |
| 6 Mar 2026 | £255,000 |
| 17 Aug 2018 | £217,250 |
14, Park View, Yeadon, Leeds LS19 7HZ
| Today | See what it's worth now |
| 5 Mar 2026 | £41,000 |
| 8 Nov 2024 | £195,000 |
No other historical records.
4, Bedford Place, Otley Road, Guiseley, Leeds LS20 8AW

| Today | See what it's worth now |
| 2 Mar 2026 | £145,000 |
| 11 Apr 2007 | £146,000 |
29, Aldersyde Road, Guiseley, Leeds LS20 8QR
| Today | See what it's worth now |
| 27 Feb 2026 | £170,000 |
| 27 Mar 2017 | £162,500 |
Stables Adjacent To, Highfield Stables, Carlton Lane, Guiseley, Leeds LS20 9PE
| Today | See what it's worth now |
| 27 Feb 2026 | £1,075,000 |
No other historical records.
49, Back Lane, Guiseley, Leeds LS20 8LS
| Today | See what it's worth now |
| 26 Feb 2026 | £585,000 |
| 8 Mar 2019 | £445,000 |
33, Ings Lane, Guiseley, Leeds LS20 8DA
| Today | See what it's worth now |
| 20 Feb 2026 | £510,000 |
| 22 Jun 2021 | £440,000 |
10, West End Terrace, Guiseley, Leeds LS20 8LX
| Today | See what it's worth now |
| 20 Feb 2026 | £195,000 |
| 27 Nov 2019 | £195,000 |
24, Hornbeam Court, Oxford Avenue, Guiseley, Leeds LS20 9BW
| Today | See what it's worth now |
| 20 Feb 2026 | £175,000 |
No other historical records.
8, Greenshaw Court, Guiseley, Leeds LS20 9FB
| Today | See what it's worth now |
| 20 Feb 2026 | £435,000 |
| 31 Oct 2013 | £239,950 |
No other historical records.
19, Park Road, Guiseley, Leeds LS20 8AR
| Today | See what it's worth now |
| 20 Feb 2026 | £208,000 |
| 18 May 2016 | £172,500 |
Source Acknowledgement: © Crown copyright. England and Wales house price data is publicly available information produced by the HM Land Registry.This material was last updated on 9 July 2026. It covers the period from 1 January 1995 to 30 April 2026 and contains property transactions which have been registered during that period. Contains HM Land Registry data © Crown copyright and database right 2026. This data is licensed under the Open Government Licence v3.0.
Disclaimer: Rightmove.co.uk provides this HM Land Registry data "as is". The burden for fitness of the data relies completely with the user and is provided for informational purposes only. No warranty, express or implied, is given relating to the accuracy of content of the HM Land Registry data and Rightmove does not accept any liability for error or omission. If you have found an error with the data or need further information please contact HM Land Registry.
Permitted Use: Viewers of this Information are granted permission to access this Crown copyright material and to download it onto electronic, magnetic, optical or similar storage media provided that such activities are for private research, study or in-house use only. Any other use of the material requires the formal written permission of Land Registry which can be requested from us, and is subject to an additional licence and associated charge.
Rightmove takes no liability for your use of, or reliance on, Rightmove's Instant Valuation due to the limitations of our tracking tool listed here. Use of this tool is taken entirely at your own risk. All rights reserved.