
House Prices in Gungrog Fawr
House prices in Gungrog Fawr have an overall average of £313,954 over the last year.
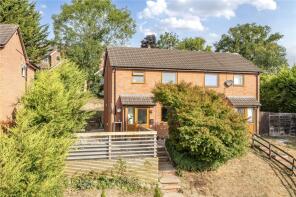
The majority of properties sold in Gungrog Fawr during the last year were detached properties, selling for an average price of £380,889. Semi-detached properties sold for an average of £209,833.
Overall, the historical sold prices in Gungrog Fawr over the last year were 1% up on the previous year and 10% up on the 2022 peak of £284,768.
Properties Sold
Hydan Cottages, Cyfronydd, Welshpool SY21 9EU
| Today | See what it's worth now |
| 11 Mar 2026 | £261,500 |
| 28 Aug 2020 | £222,000 |
11, Maesgarmon, Castle Caereinion, Welshpool SY21 9AN
| Today | See what it's worth now |
| 27 Feb 2026 | £203,000 |
| 12 Oct 2000 | £50,000 |
No other historical records.
83, Gungrog Hill, Welshpool SY21 7UL
| Today | See what it's worth now |
| 30 Jan 2026 | £171,000 |
| 2 Feb 2018 | £105,000 |
25, Oldcastle Avenue, Guilsfield, Welshpool SY21 9PA
| Today | See what it's worth now |
| 28 Jan 2026 | £230,000 |
| 20 Mar 1998 | £53,950 |
No other historical records.
2, Acrefield Avenue, Guilsfield, Welshpool SY21 9PN

| Today | See what it's worth now |
| 9 Dec 2025 | £340,000 |
| 15 Sep 2015 | £239,000 |
18, Llwyn Nant, Guilsfield, Welshpool SY21 9FD
| Today | See what it's worth now |
| 5 Dec 2025 | £419,950 |
No other historical records.
1, Raylaw Avenue, Guilsfield, Welshpool SY21 9LY

| Today | See what it's worth now |
| 27 Nov 2025 | £261,000 |
| 3 Apr 2006 | £160,000 |
Heniarth Mill, Llangyniew, Welshpool SY21 9EN
| Today | See what it's worth now |
| 31 Oct 2025 | £615,000 |
No other historical records.
Lane Bungalow, Laundry Lane, Moelygarth, Welshpool SY21 9JF
| Today | See what it's worth now |
| 24 Oct 2025 | £140,000 |
No other historical records.
Llidiart Wood, Laundry Lane, Moelygarth, Welshpool SY21 9JF
| Today | See what it's worth now |
| 24 Oct 2025 | £675,000 |
No other historical records.
3, Rock Terrace, Groesllwyd, Guilsfield SY21 9NY
| Today | See what it's worth now |
| 17 Oct 2025 | £170,000 |
No other historical records.
Ashdene, Guilsfield, Welshpool SY21 9PP
| Today | See what it's worth now |
| 16 Oct 2025 | £385,000 |
| 16 Mar 2021 | £362,000 |
No other historical records.
30, Brynfa Avenue, Welshpool SY21 7TS

| Today | See what it's worth now |
| 15 Oct 2025 | £280,000 |
| 31 Oct 2003 | £155,000 |
6, Glanaber Drive, Guilsfield, Welshpool SY21 9PW
| Today | See what it's worth now |
| 2 Oct 2025 | £260,000 |
| 20 Nov 2020 | £175,000 |
No other historical records.
5, Acrefield Avenue, Guilsfield, Welshpool SY21 9PN
| Today | See what it's worth now |
| 19 Sep 2025 | £210,000 |
| 15 Jul 2016 | £165,000 |
15, Llwyn Nant, Guilsfield, Welshpool SY21 9FD
| Today | See what it's worth now |
| 15 Sep 2025 | £249,000 |
No other historical records.
7, Dolwen, Guilsfield, Welshpool SY21 9PL
| Today | See what it's worth now |
| 27 Aug 2025 | £258,500 |
No other historical records.
Plot 28, Residential Development Of 46 Dwellings At, Sarn Meadows, Guilsfield, Welshpool SY21 9PP
| Today | See what it's worth now |
| 15 Aug 2025 | £253,000 |
No other historical records.
Llanerch, Glyndwr Crescent, Guilsfield, Welshpool SY21 9QA
| Today | See what it's worth now |
| 1 Aug 2025 | £375,000 |
| 5 Nov 1998 | £115,000 |
No other historical records.
Meadow Brook Cottage, Groes-pluen, Welshpool SY21 9BP
| Today | See what it's worth now |
| 31 Jul 2025 | £535,000 |
| 9 Mar 2021 | £340,000 |
No other historical records.
Bryn Hyfryd, Cwm Golau, Cyfronydd SY21 9EZ

| Today | See what it's worth now |
| 24 Jul 2025 | £390,000 |
No other historical records.
32, Brynfa Avenue, Welshpool SY21 7TS
| Today | See what it's worth now |
| 24 Jul 2025 | £395,000 |
| 9 Feb 2021 | £270,000 |
1, Swallows Field, Castle Caereinion, Welshpool SY21 9BF
| Today | See what it's worth now |
| 4 Jul 2025 | £144,000 |
| 16 Dec 2022 | £140,000 |
No other historical records.
Source Acknowledgement: © Crown copyright. England and Wales house price data is publicly available information produced by the HM Land Registry.This material was last updated on 9 July 2026. It covers the period from 1 January 1995 to 30 April 2026 and contains property transactions which have been registered during that period. Contains HM Land Registry data © Crown copyright and database right 2026. This data is licensed under the Open Government Licence v3.0.
Disclaimer: Rightmove.co.uk provides this HM Land Registry data "as is". The burden for fitness of the data relies completely with the user and is provided for informational purposes only. No warranty, express or implied, is given relating to the accuracy of content of the HM Land Registry data and Rightmove does not accept any liability for error or omission. If you have found an error with the data or need further information please contact HM Land Registry.
Permitted Use: Viewers of this Information are granted permission to access this Crown copyright material and to download it onto electronic, magnetic, optical or similar storage media provided that such activities are for private research, study or in-house use only. Any other use of the material requires the formal written permission of Land Registry which can be requested from us, and is subject to an additional licence and associated charge.
Rightmove takes no liability for your use of, or reliance on, Rightmove's Instant Valuation due to the limitations of our tracking tool listed here. Use of this tool is taken entirely at your own risk. All rights reserved.