
House Prices in Gwindra
House prices in Gwindra have an overall average of £295,290 over the last year.
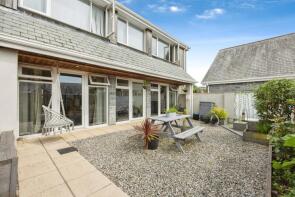
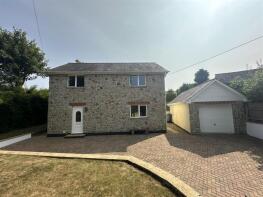
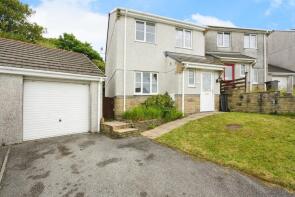
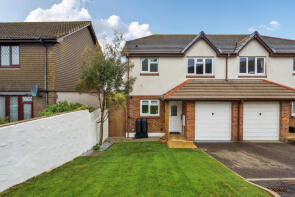
The majority of properties sold in Gwindra during the last year were detached properties, selling for an average price of £366,699. Terraced properties sold for an average of £207,469, with semi-detached properties fetching £227,471.
Overall, the historical sold prices in Gwindra over the last year were 3% down on the previous year and similar to the 2023 peak of £297,435.
Properties Sold
Bramble Cottage, Access To Malreen, Coombe, St. Austell PL26 7LJ
| Today | See what it's worth now |
| 11 Dec 2025 | £405,000 |
| 14 Sep 2011 | £267,000 |
51, Trethosa Road, St. Austell PL26 7PZ
| Today | See what it's worth now |
| 8 Dec 2025 | £270,000 |
| 18 Jun 2021 | £220,000 |
No other historical records.
17, Cotswold Avenue, St. Austell PL26 7ER
| Today | See what it's worth now |
| 8 Dec 2025 | £325,000 |
| 8 Jan 2021 | £255,000 |
81, Currian Road, St. Austell PL26 7YD
| Today | See what it's worth now |
| 2 Dec 2025 | £170,000 |
| 19 Dec 2019 | £155,000 |
No other historical records.
37, Fortescue Close, St. Austell PL26 7XT


| Today | See what it's worth now |
| 28 Nov 2025 | £169,500 |
| 27 Jan 2023 | £160,500 |
4, Lower Meadows, St. Austell PL26 7FB
| Today | See what it's worth now |
| 28 Nov 2025 | £129,500 |
| 23 Mar 2018 | £105,000 |
No other historical records.
Stonelea, Chapel Hill, St. Austell PL26 7HG
| Today | See what it's worth now |
| 20 Nov 2025 | £395,000 |
| 26 Oct 2020 | £325,000 |
No other historical records.
11, Hillside Meadows, St. Austell PL26 7TA
| Today | See what it's worth now |
| 23 Oct 2025 | £225,000 |
| 20 Aug 2021 | £225,000 |
1, Mclean Drive, St. Austell PL26 7TS
| Today | See what it's worth now |
| 17 Oct 2025 | £255,000 |
| 12 Apr 2019 | £192,500 |
1, Sea View Cottage, North Road, Whitemoor, St. Austell PL26 7XL
| Today | See what it's worth now |
| 8 Oct 2025 | £200,000 |
| 7 Feb 1997 | £32,500 |
No other historical records.
Owrek, Coombe Road, Lanjeth, High Street PL26 7TL
| Today | See what it's worth now |
| 26 Sep 2025 | £285,000 |
No other historical records.
27, Churchtown Meadows, St. Austell PL26 7NF
| Today | See what it's worth now |
| 26 Sep 2025 | £380,000 |
| 24 Nov 1995 | £57,000 |
No other historical records.
Ryn Cottage, Road From Fore Street To Chapel Hill, St. Austell PL26 7BY
| Today | See what it's worth now |
| 12 Sep 2025 | £197,500 |
| 17 Jun 2015 | £99,900 |
No other historical records.
15, Ashdown Close, St. Austell PL26 7EU
| Today | See what it's worth now |
| 11 Sep 2025 | £300,000 |
| 12 Jan 2009 | £165,000 |
No other historical records.
The Cottage, Tregorrick Road, Tregorrick, St. Austell PL26 7AG
| Today | See what it's worth now |
| 10 Sep 2025 | £462,000 |
| 19 Dec 2006 | £250,000 |
No other historical records.
Rowanleat, Chapel Hill, St. Austell PL26 7BU
| Today | See what it's worth now |
| 29 Aug 2025 | £325,000 |
| 11 Aug 2000 | £88,500 |
No other historical records.
23, Grenville Meadows, St. Austell PL26 7ZA
| Today | See what it's worth now |
| 27 Aug 2025 | £220,000 |
| 18 Feb 2008 | £170,600 |
No other historical records.
35, Chegwyns Hill, St. Austell PL26 7UY
| Today | See what it's worth now |
| 22 Aug 2025 | £160,000 |
| 23 Mar 2016 | £112,000 |
Stray Park Cottage, Peters Hill, High Street PL26 7SS
| Today | See what it's worth now |
| 20 Aug 2025 | £200,000 |
No other historical records.
Hawklands, Hornick Hill, St. Austell PL26 7TR
| Today | See what it's worth now |
| 19 Aug 2025 | £380,000 |
| 20 Nov 2019 | £230,000 |
Browning, Newgate Cottage, Coombe Road, Lanjeth, High Street PL26 7TL
| Today | See what it's worth now |
| 15 Aug 2025 | £205,000 |
| 21 Feb 1995 | £35,000 |
No other historical records.
54 Harcourt, Trethosa Road, St. Austell PL26 7PZ
| Today | See what it's worth now |
| 15 Aug 2025 | £154,000 |
| 1 Dec 2006 | £170,000 |
215, Creakavose Park, St. Austell PL26 7ND

| Today | See what it's worth now |
| 15 Aug 2025 | £335,000 |
| 8 Sep 1997 | £59,950 |
No other historical records.
1, Rose Hill, St. Austell PL26 7EJ

| Today | See what it's worth now |
| 13 Aug 2025 | £285,000 |
| 27 Jun 2003 | £140,000 |
No other historical records.
7, Rectory Road, St. Austell PL26 7RJ
| Today | See what it's worth now |
| 12 Aug 2025 | £310,000 |
| 1 Mar 2013 | £178,000 |
Source Acknowledgement: © Crown copyright. England and Wales house price data is publicly available information produced by the HM Land Registry.This material was last updated on 4 February 2026. It covers the period from 1 January 1995 to 24 December 2025 and contains property transactions which have been registered during that period. Contains HM Land Registry data © Crown copyright and database right 2026. This data is licensed under the Open Government Licence v3.0.
Disclaimer: Rightmove.co.uk provides this HM Land Registry data "as is". The burden for fitness of the data relies completely with the user and is provided for informational purposes only. No warranty, express or implied, is given relating to the accuracy of content of the HM Land Registry data and Rightmove does not accept any liability for error or omission. If you have found an error with the data or need further information please contact HM Land Registry.
Permitted Use: Viewers of this Information are granted permission to access this Crown copyright material and to download it onto electronic, magnetic, optical or similar storage media provided that such activities are for private research, study or in-house use only. Any other use of the material requires the formal written permission of Land Registry which can be requested from us, and is subject to an additional licence and associated charge.
Map data ©OpenStreetMap contributors.
Rightmove takes no liability for your use of, or reliance on, Rightmove's Instant Valuation due to the limitations of our tracking tool listed here. Use of this tool is taken entirely at your own risk. All rights reserved.