
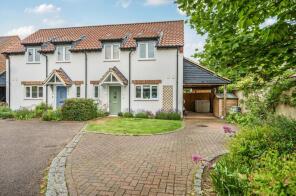
House Prices in Haddenham
House prices in Haddenham have an overall average of £523,466 over the last year.
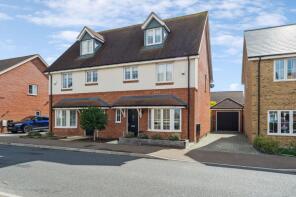
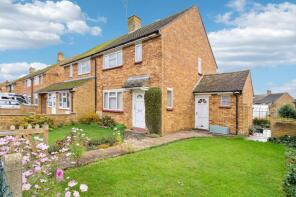
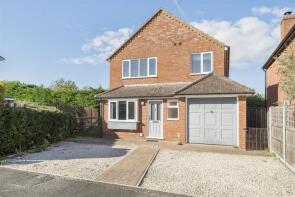
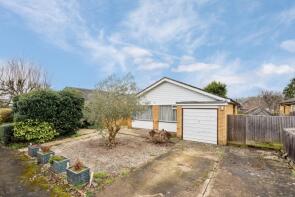
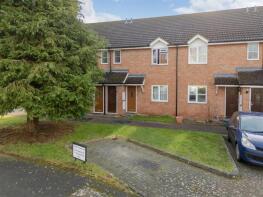
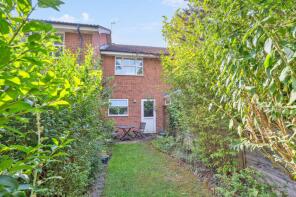
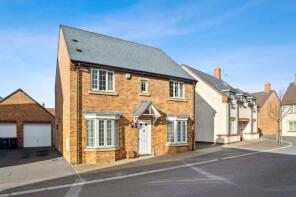
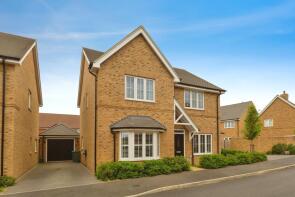
The majority of properties sold in Haddenham during the last year were detached properties, selling for an average price of £638,625. Semi-detached properties sold for an average of £441,447, with terraced properties fetching £370,056.
Overall, the historical sold prices in Haddenham over the last year were 7% down on the previous year and 3% down on the 2023 peak of £541,957.
Properties Sold
8, Sedgwick Street, Aylesbury HP17 8FF
| Today | See what it's worth now |
| 18 Mar 2026 | £610,000 |
| 20 Mar 2020 | £569,950 |
No other historical records.
67, Sheerstock, Aylesbury HP17 8EY
| Today | See what it's worth now |
| 13 Mar 2026 | £290,000 |
| 11 Mar 2011 | £186,000 |
No other historical records.
21, Roberts Road, Haddenham HP17 8HH
| Today | See what it's worth now |
| 13 Mar 2026 | £370,000 |
No other historical records.
89, Wykeham Way, Aylesbury HP17 8BU
| Today | See what it's worth now |
| 13 Mar 2026 | £485,000 |
| 3 Jun 2019 | £450,000 |
Flat 14, 2, Tibbs Road, Haddenham HP17 8ZA

| Today | See what it's worth now |
| 13 Mar 2026 | £295,500 |
| 16 Oct 2020 | £206,500 |
No other historical records.
44, Wykeham Way, Aylesbury HP17 8BX
| Today | See what it's worth now |
| 10 Mar 2026 | £570,000 |
| 13 May 2016 | £450,000 |
No other historical records.
Long Honey, Church End, Aylesbury HP17 8AE
| Today | See what it's worth now |
| 27 Feb 2026 | £1,200,000 |
| 26 Jan 2009 | £830,000 |
10, Plover Furlong, Haddenham HP17 8YU
| Today | See what it's worth now |
| 20 Feb 2026 | £540,000 |
No other historical records.
6, Mallard Croft, Aylesbury HP17 8EF
| Today | See what it's worth now |
| 30 Jan 2026 | £535,000 |
| 19 Oct 2012 | £370,000 |
No other historical records.
3, Kemps Piece, High Street, Aylesbury HP17 8LA
| Today | See what it's worth now |
| 27 Jan 2026 | £750,000 |
| 13 Oct 2000 | £305,000 |
No other historical records.
11, Coxon Close, Aylesbury HP17 8DE
| Today | See what it's worth now |
| 23 Jan 2026 | £575,000 |
| 20 Mar 2020 | £572,450 |
No other historical records.
7, Stokes End, Aylesbury HP17 8DX
| Today | See what it's worth now |
| 16 Jan 2026 | £700,000 |
| 27 Aug 2021 | £590,000 |
No other historical records.
4, Anxey Way, Aylesbury HP17 8DJ
| Today | See what it's worth now |
| 19 Dec 2025 | £160,000 |
| 21 Sep 2010 | £67,500 |
No other historical records.
42, Anxey Way, Aylesbury HP17 8DJ
| Today | See what it's worth now |
| 15 Dec 2025 | £320,000 |
| 5 Jan 2004 | £160,000 |
No other historical records.
8, Cotts Field, Aylesbury HP17 8NN
| Today | See what it's worth now |
| 12 Dec 2025 | £545,000 |
| 12 May 2023 | £565,000 |
3, Lovell Way, Aylesbury HP17 8FD
| Today | See what it's worth now |
| 4 Dec 2025 | £720,000 |
| 30 Mar 2022 | £629,950 |
No other historical records.
22, Quakers Mede, Haddenham HP17 8EB
| Today | See what it's worth now |
| 4 Dec 2025 | £525,000 |
No other historical records.
15, Printers Piece, Aylesbury HP17 8NF
| Today | See what it's worth now |
| 3 Dec 2025 | £625,000 |
| 26 Mar 2013 | £450,000 |
No other historical records.
10, Barn Owl Lane, Aylesbury HP17 8FR

| Today | See what it's worth now |
| 28 Nov 2025 | £415,000 |
| 28 Aug 2020 | £372,000 |
No other historical records.
19, Sedgwick Street, Aylesbury HP17 8FF

| Today | See what it's worth now |
| 28 Nov 2025 | £585,000 |
| 19 Apr 2021 | £659,950 |
No other historical records.
52, Stokes Croft, Aylesbury HP17 8DZ
| Today | See what it's worth now |
| 28 Nov 2025 | £497,000 |
| 27 Jul 2005 | £285,000 |
No other historical records.
48, Thame Road, Aylesbury HP17 8EP
| Today | See what it's worth now |
| 28 Nov 2025 | £373,000 |
| 18 May 2004 | £193,500 |
11, Rose Meadow, Aylesbury HP17 8FQ
| Today | See what it's worth now |
| 28 Nov 2025 | £525,000 |
| 10 Dec 2019 | £449,950 |
No other historical records.
Source Acknowledgement: © Crown copyright. England and Wales house price data is publicly available information produced by the HM Land Registry.This material was last updated on 9 July 2026. It covers the period from 1 January 1995 to 30 April 2026 and contains property transactions which have been registered during that period. Contains HM Land Registry data © Crown copyright and database right 2026. This data is licensed under the Open Government Licence v3.0.
Disclaimer: Rightmove.co.uk provides this HM Land Registry data "as is". The burden for fitness of the data relies completely with the user and is provided for informational purposes only. No warranty, express or implied, is given relating to the accuracy of content of the HM Land Registry data and Rightmove does not accept any liability for error or omission. If you have found an error with the data or need further information please contact HM Land Registry.
Permitted Use: Viewers of this Information are granted permission to access this Crown copyright material and to download it onto electronic, magnetic, optical or similar storage media provided that such activities are for private research, study or in-house use only. Any other use of the material requires the formal written permission of Land Registry which can be requested from us, and is subject to an additional licence and associated charge.
Rightmove takes no liability for your use of, or reliance on, Rightmove's Instant Valuation due to the limitations of our tracking tool listed here. Use of this tool is taken entirely at your own risk. All rights reserved.