
House Prices in Hadlow
House prices in Hadlow have an overall average of £393,983 over the last year.
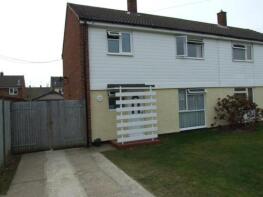
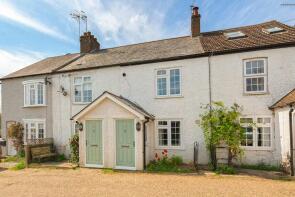
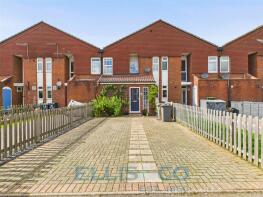
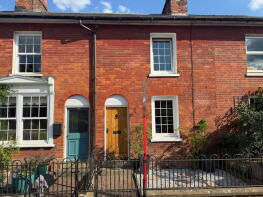
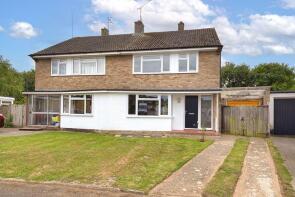
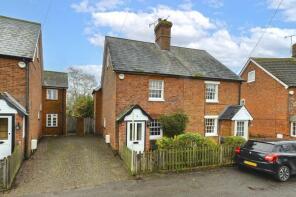
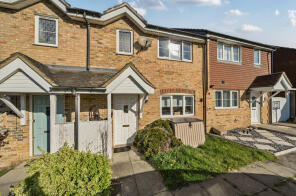
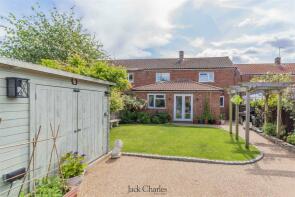
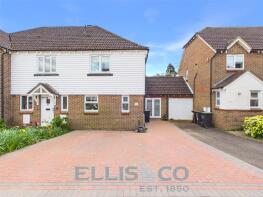
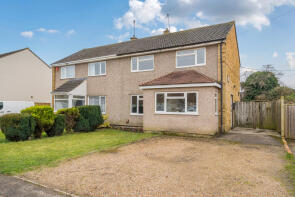
The majority of properties sold in Hadlow during the last year were semi-detached properties, selling for an average price of £378,818. Terraced properties sold for an average of £324,286, with detached properties fetching £835,000.
Overall, the historical sold prices in Hadlow over the last year were 26% down on the previous year and 36% down on the 2023 peak of £612,111.
Properties Sold
32, Twyford Road, Hadlow, Tonbridge TN11 0HJ
| Today | See what it's worth now |
| 2 Apr 2026 | £350,000 |
| 25 Mar 2011 | £240,000 |
30, Great Elms, Hadlow, Tonbridge TN11 0HT

| Today | See what it's worth now |
| 1 Apr 2026 | £915,000 |
| 7 Apr 2022 | £575,000 |
No other historical records.
7, Pittswood Cottages, Ashes Lane, Hadlow, Tonbridge TN11 0AR
| Today | See what it's worth now |
| 16 Mar 2026 | £345,000 |
| 26 Oct 2017 | £317,000 |
13, Marshall Gardens, Hadlow, Tonbridge TN11 0HQ
| Today | See what it's worth now |
| 2 Mar 2026 | £330,000 |
| 18 Dec 2017 | £280,000 |
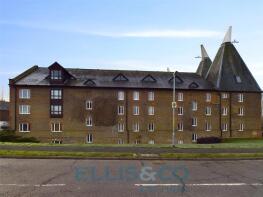
25, The Maltings, Carpenters Lane, Hadlow, Tonbridge TN11 0DQ
| Today | See what it's worth now |
| 20 Feb 2026 | £182,500 |
No other historical records.
9, Lonewood Way, Hadlow, Tonbridge TN11 0JB
| Today | See what it's worth now |
| 29 Jan 2026 | £340,000 |
| 22 Sep 1999 | £97,000 |
No other historical records.
29, The Maltings, Carpenters Lane, Hadlow, Tonbridge TN11 0DQ

| Today | See what it's worth now |
| 16 Jan 2026 | £111,100 |
| 14 Oct 2013 | £112,500 |
25, The Forstal, Hadlow, Tonbridge TN11 0RT
| Today | See what it's worth now |
| 9 Jan 2026 | £405,000 |
| 11 May 2017 | £355,000 |
3, Castle View, High Street, Hadlow, Tonbridge TN11 0BY
| Today | See what it's worth now |
| 4 Dec 2025 | £295,000 |
| 3 Mar 2017 | £245,000 |
No other historical records.
10 The Old Stables, Kenward Court, Hadlow, Tonbridge TN11 0DX
| Today | See what it's worth now |
| 3 Dec 2025 | £425,000 |
| 8 Aug 1996 | £110,000 |
No other historical records.
7, Castle Terrace, High Street, Hadlow, Tonbridge TN11 0BX
| Today | See what it's worth now |
| 3 Dec 2025 | £330,000 |
| 24 Jun 2014 | £189,000 |
31, The Cherry Orchard, Hadlow, Tonbridge TN11 0HU
| Today | See what it's worth now |
| 21 Nov 2025 | £375,000 |
No other historical records.
11, Toby Gardens, Hadlow, Tonbridge TN11 0EW
| Today | See what it's worth now |
| 27 Oct 2025 | £490,000 |
| 21 Jun 2013 | £270,000 |
No other historical records.
3, Blackmans Lane, Hadlow, Tonbridge TN11 0AX
| Today | See what it's worth now |
| 3 Oct 2025 | £360,000 |
| 24 Mar 2004 | £267,500 |
No other historical records.
12, Monypenny Close, Hadlow, Tonbridge TN11 0LG
| Today | See what it's worth now |
| 26 Sep 2025 | £195,000 |
| 1 Sep 2022 | £195,000 |
No other historical records.
7, The Maltings, Carpenters Lane, Hadlow, Tonbridge TN11 0DQ
| Today | See what it's worth now |
| 4 Sep 2025 | £220,000 |
No other historical records.
16, Lonewood Way, Hadlow, Tonbridge TN11 0JB
| Today | See what it's worth now |
| 4 Sep 2025 | £407,000 |
No other historical records.
20, Hailstone Close, Hadlow, Tonbridge TN11 0JY
| Today | See what it's worth now |
| 1 Sep 2025 | £315,000 |
| 15 Oct 2010 | £190,000 |
No other historical records.
14, The Cherry Orchard, Hadlow, Tonbridge TN11 0HU
| Today | See what it's worth now |
| 29 Aug 2025 | £375,000 |
No other historical records.
8, Maltings Close, Hadlow, Tonbridge TN11 0DY

| Today | See what it's worth now |
| 15 Aug 2025 | £350,000 |
| 31 Jul 2019 | £299,000 |
The Shires, Court Lane, Hadlow, Tonbridge TN11 0JU

| Today | See what it's worth now |
| 23 Jul 2025 | £1,100,000 |
| 17 Nov 2015 | £945,000 |
No other historical records.
17, Twyford Road, Hadlow, Tonbridge TN11 0HJ
| Today | See what it's worth now |
| 8 Jul 2025 | £450,000 |
| 29 Jul 2016 | £308,000 |
22, The Forstal, Hadlow, Tonbridge TN11 0RT
| Today | See what it's worth now |
| 7 Jul 2025 | £390,000 |
| 4 Jul 2006 | £227,000 |
No other historical records.

Source Acknowledgement: © Crown copyright. England and Wales house price data is publicly available information produced by the HM Land Registry.This material was last updated on 9 July 2026. It covers the period from 1 January 1995 to 30 April 2026 and contains property transactions which have been registered during that period. Contains HM Land Registry data © Crown copyright and database right 2026. This data is licensed under the Open Government Licence v3.0.
Disclaimer: Rightmove.co.uk provides this HM Land Registry data "as is". The burden for fitness of the data relies completely with the user and is provided for informational purposes only. No warranty, express or implied, is given relating to the accuracy of content of the HM Land Registry data and Rightmove does not accept any liability for error or omission. If you have found an error with the data or need further information please contact HM Land Registry.
Permitted Use: Viewers of this Information are granted permission to access this Crown copyright material and to download it onto electronic, magnetic, optical or similar storage media provided that such activities are for private research, study or in-house use only. Any other use of the material requires the formal written permission of Land Registry which can be requested from us, and is subject to an additional licence and associated charge.
Rightmove takes no liability for your use of, or reliance on, Rightmove's Instant Valuation due to the limitations of our tracking tool listed here. Use of this tool is taken entirely at your own risk. All rights reserved.