
House Prices in Hallow Bank
House prices in Hallow Bank have an overall average of £439,761 over the last year.
The majority of properties sold in Hallow Bank during the last year were semi-detached properties, selling for an average price of £392,250. Detached properties sold for an average of £625,214, with terraced properties fetching £303,333.
Overall, the historical sold prices in Hallow Bank over the last year were 6% down on the previous year and 6% down on the 2022 peak of £467,286.
Properties Sold
5, Watchgate, Selside, Kendal LA8 9JX
| Today | See today's value |
| 10 Aug 2026 | £375,000 |
| 14 Apr 2003 | £155,000 |
High Reston Barn, Staveley, Kendal LA8 9PT

| Today | See today's value |
| 21 Jul 2026 | £530,000 |
| 14 Aug 2023 | £525,000 |
4, Gatefoot Cottages, Windermere Road, Kendal LA8 9PL
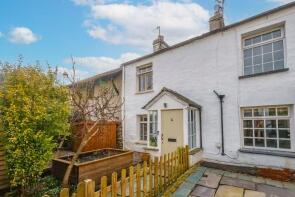
| Today | See today's value |
| 21 Jul 2026 | £335,000 |
| 31 Aug 2022 | £295,000 |
No other historical records.
Over Yonder Barn, Selside, Kendal LA8 9EA
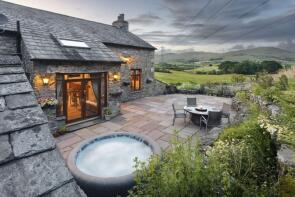
| Today | See today's value |
| 17 Jul 2026 | £590,000 |
| 13 Jul 2018 | £420,000 |
Woodland View, The Banks, Kendal LA8 9NE
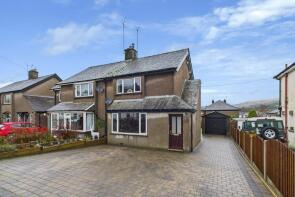
| Today | See today's value |
| 9 Jul 2026 | £410,000 |
| 19 Jul 2019 | £285,000 |
No other historical records.
10, Meadow Close, Bowston LA8 9HA
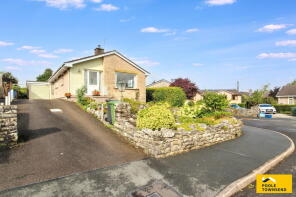
| Today | See today's value |
| 18 Jun 2026 | £391,000 |
No other historical records.
37, Beck Nook, Staveley LA8 9ND
| Today | See today's value |
| 29 May 2026 | £190,000 |
No other historical records.
Overbeck, Garnett Bridge, Kendal LA8 9AZ
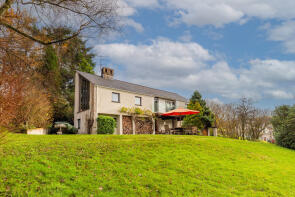
| Today | See today's value |
| 8 May 2026 | £750,000 |
| 30 Oct 1998 | £165,000 |
No other historical records.
7, Ash View, Kendal LA8 9DN

| Today | See today's value |
| 17 Apr 2026 | £350,000 |
| 5 Nov 2021 | £285,000 |
3, Ash View, Kendal LA8 9DN

| Today | See today's value |
| 10 Apr 2026 | £230,000 |
| 19 Dec 2014 | £168,000 |
4, Scarfoot, Mealbank, Kendal LA8 9DJ

| Today | See today's value |
| 27 Mar 2026 | £190,000 |
| 27 Jan 2017 | £160,500 |
No other historical records.
Woodside, Ings, Kendal LA8 9PY

| Today | See today's value |
| 13 Mar 2026 | £740,000 |
| 8 Apr 2004 | £307,500 |
No other historical records.
3, Spring Howe, Skelsmergh, Kendal LA9 6NU

| Today | See today's value |
| 9 Feb 2026 | £400,000 |
| 2 Aug 2019 | £340,000 |
No other historical records.
2, Beck Nook, Staveley LA8 9ND
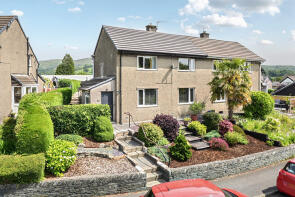
| Today | See today's value |
| 19 Jan 2026 | £300,000 |
No other historical records.
Hill Farm Barn, Garnett Bridge Road, Kendal LA8 9AU

| Today | See today's value |
| 7 Jan 2026 | £800,000 |
| 26 May 2006 | £479,000 |
12, Gowan Crescent, Kendal LA8 9NF

| Today | See today's value |
| 17 Dec 2025 | £452,000 |
| 18 Jun 1999 | £87,500 |
No other historical records.
18, Beck Nook, Kendal LA8 9ND

| Today | See today's value |
| 12 Dec 2025 | £250,000 |
| 23 Dec 2003 | £130,000 |
No other historical records.
Helm Lea, The Banks, Kendal LA8 9NE

| Today | See today's value |
| 14 Nov 2025 | £471,000 |
| 3 Jan 2017 | £320,000 |
No other historical records.
Strathmore, Grayrigg, Kendal LA8 9BU

| Today | See today's value |
| 10 Nov 2025 | £500,000 |
No other historical records.
Meadowbank Lodge, Windermere Road, Staveley LA8 9LY

| Today | See today's value |
| 7 Nov 2025 | £285,500 |
No other historical records.
Greenholme, Ings, Kendal LA8 9QQ

| Today | See today's value |
| 17 Oct 2025 | £910,000 |
| 21 Dec 2011 | £275,000 |
No other historical records.
Station House, The Banks, Kendal LA8 9NE

| Today | See today's value |
| 8 Oct 2025 | £325,000 |
| 29 Mar 2018 | £289,550 |
No other historical records.
4, Gowan Terrace, Kendal LA8 9LW

| Today | See today's value |
| 3 Oct 2025 | £340,000 |
| 12 May 2004 | £172,000 |
No other historical records.
Rightmove takes no liability for your use of, or reliance on, Rightmove's Instant Valuation due to the limitations of our tracking tool listed here. Use of this tool is taken entirely at your own risk. All rights reserved.