
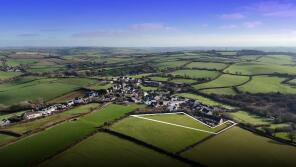
House Prices in Halwell
House prices in Halwell have an overall average of £465,000 over the last year.
Overall, the historical sold prices in Halwell over the last year were 48% up on the previous year and 37% down on the 2022 peak of £739,682.
Properties Sold
10, Crocadon Meadows, Totnes TQ9 7LH
| Today | See what it's worth now |
| 25 Sep 2025 | £465,000 |
| 12 Dec 2006 | £345,000 |
2, Stanborough Court, Back Road End To Moreleigh Cross Along Zc793, Totnes TQ9 7NT
| Today | See what it's worth now |
| 31 Jul 2025 | £327,500 |
| 8 Apr 2014 | £250,000 |
7, Crocadon Meadows, Totnes TQ9 7LH

| Today | See what it's worth now |
| 21 Jul 2025 | £507,500 |
| 15 Jun 2022 | £501,000 |
Garden Cottage, Higher Poulston Farm, Lane To Higher And Lower Poulston Farms, Totnes TQ9 7LE
| Today | See what it's worth now |
| 1 Jul 2025 | £240,000 |
| 26 Jun 2017 | £225,000 |
No other historical records.
Alms Cottage, Church Street, Totnes TQ9 7JB
| Today | See what it's worth now |
| 2 Sep 2024 | £288,000 |
| 20 Aug 2014 | £212,000 |
Anvil Cottage, Back Road End To Moreleigh Cross Along Zc793, Totnes TQ9 7JJ

| Today | See what it's worth now |
| 16 Jul 2024 | £203,000 |
| 24 Mar 2017 | £190,000 |
No other historical records.
1, White Park, Totnes TQ9 7JL
| Today | See what it's worth now |
| 2 May 2024 | £300,000 |
| 29 May 2009 | £160,000 |
No other historical records.
Boreston Foot Cottage, Spanish Lane End To Moreleigh Cross Along Zc393, Totnes TQ9 7LD

| Today | See what it's worth now |
| 15 Mar 2024 | £1,361,000 |
| 16 Dec 2022 | £1,160,000 |
26, Crocadon Meadows, Totnes TQ9 7LH
| Today | See what it's worth now |
| 12 Feb 2024 | £350,000 |
| 21 Jul 2020 | £270,000 |
The Hayloft, Higher Poulston Farm, Lane To Higher And Lower Poulston Farms, Totnes TQ9 7LE
| Today | See what it's worth now |
| 21 Dec 2023 | £260,000 |
| 28 Jul 2016 | £190,000 |
No other historical records.
8, Moreleigh Heights, Totnes TQ9 7FH

| Today | See what it's worth now |
| 24 Aug 2023 | £290,000 |
| 28 Feb 2018 | £195,000 |
No other historical records.
19, Crocadon Meadows, Totnes TQ9 7LH

| Today | See what it's worth now |
| 17 Mar 2023 | £325,000 |
| 5 Mar 2012 | £202,000 |
Knowle House, Higher Poulston Farm, Lane To Higher And Lower Poulston Farms, Totnes TQ9 7LE

| Today | See what it's worth now |
| 16 Nov 2022 | £2,550,000 |
No other historical records.
Plough Cottage, Higher Poulston Farm, Lane To Higher And Lower Poulston Farms, Totnes TQ9 7LE
| Today | See what it's worth now |
| 22 Aug 2022 | £330,500 |
No other historical records.
The Farmhouse, Higher Poulston Farm, Lane To Higher And Lower Poulston Farms, Totnes TQ9 7LE
| Today | See what it's worth now |
| 21 Jul 2022 | £1,000,000 |
| 23 Nov 2015 | £125,000 |
No other historical records.
4, Crocadon Meadows, Totnes TQ9 7LH

| Today | See what it's worth now |
| 1 Jul 2022 | £565,000 |
| 5 Apr 2007 | £336,500 |
15, Crocadon Meadows, Totnes TQ9 7LH

| Today | See what it's worth now |
| 11 Apr 2022 | £320,000 |
| 15 Jul 2016 | £225,000 |
14, Crocadon Meadows, Totnes TQ9 7LH
| Today | See what it's worth now |
| 11 Apr 2022 | £475,000 |
| 30 Jun 2000 | £157,950 |
No other historical records.
Hlothran, Church Street, Totnes TQ9 7JB

| Today | See what it's worth now |
| 18 Mar 2022 | £380,000 |
| 19 Dec 2012 | £230,000 |
6, Moreleigh Green, Spanish Lane Cross To Moreleigh Cross, Totnes TQ9 7JD
| Today | See what it's worth now |
| 1 Mar 2022 | £410,000 |
| 16 Dec 2011 | £290,000 |
10, Moreleigh Green, Spanish Lane Cross To Moreleigh Cross, Totnes TQ9 7JD
| Today | See what it's worth now |
| 26 Jan 2022 | £445,000 |
No other historical records.
1, Church Street, Totnes TQ9 7JB

| Today | See what it's worth now |
| 10 Sep 2021 | £250,000 |
| 1 Mar 2004 | £187,000 |
6, Moreleigh Heights, Totnes TQ9 7FH

| Today | See what it's worth now |
| 27 Aug 2021 | £240,000 |
| 20 Dec 2019 | £190,000 |
No other historical records.

Source Acknowledgement: © Crown copyright. England and Wales house price data is publicly available information produced by the HM Land Registry.This material was last updated on 9 July 2026. It covers the period from 1 January 1995 to 30 April 2026 and contains property transactions which have been registered during that period. Contains HM Land Registry data © Crown copyright and database right 2026. This data is licensed under the Open Government Licence v3.0.
Disclaimer: Rightmove.co.uk provides this HM Land Registry data "as is". The burden for fitness of the data relies completely with the user and is provided for informational purposes only. No warranty, express or implied, is given relating to the accuracy of content of the HM Land Registry data and Rightmove does not accept any liability for error or omission. If you have found an error with the data or need further information please contact HM Land Registry.
Permitted Use: Viewers of this Information are granted permission to access this Crown copyright material and to download it onto electronic, magnetic, optical or similar storage media provided that such activities are for private research, study or in-house use only. Any other use of the material requires the formal written permission of Land Registry which can be requested from us, and is subject to an additional licence and associated charge.
Rightmove takes no liability for your use of, or reliance on, Rightmove's Instant Valuation due to the limitations of our tracking tool listed here. Use of this tool is taken entirely at your own risk. All rights reserved.