
House Prices in Hangleton
House prices in Hangleton have an overall average of £541,992 over the last year.
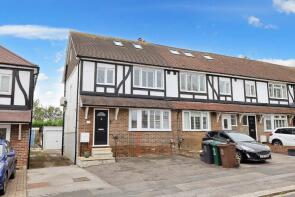
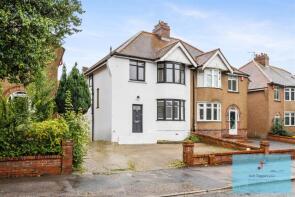
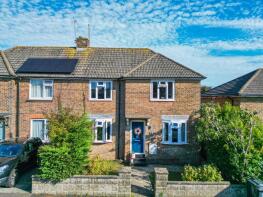
The majority of properties sold in Hangleton during the last year were semi-detached properties, selling for an average price of £590,536. Detached properties sold for an average of £589,553, with terraced properties fetching £529,833.
Overall, the historical sold prices in Hangleton over the last year were 10% up on the previous year and 4% up on the 2022 peak of £521,922.
Properties Sold
42, Sunninghill Close, Hove BN3 8JD

| Today | See what it's worth now |
| 17 Apr 2026 | £390,000 |
| 20 Jul 2005 | £245,000 |
54, Rowan Avenue, Hove BN3 7JG
| Today | See what it's worth now |
| 2 Apr 2026 | £575,000 |
| 27 Mar 2020 | £470,000 |
28, Holmes Avenue, Hove BN3 7LA

| Today | See what it's worth now |
| 2 Apr 2026 | £595,000 |
| 26 Feb 2004 | £260,000 |
5, Meadway Crescent, Hove BN3 7NJ

| Today | See what it's worth now |
| 31 Mar 2026 | £405,000 |
No other historical records.
77, Northease Drive, Hove BN3 8PP

| Today | See what it's worth now |
| 31 Mar 2026 | £500,000 |
No other historical records.
Flat 23, 14 Alexandra Court, St Peters Close, Hove BN3 7RF

| Today | See what it's worth now |
| 24 Mar 2026 | £190,000 |
| 29 Mar 2001 | £165,950 |
No other historical records.
16, Godwin Road, Hove BN3 7FR

| Today | See what it's worth now |
| 24 Mar 2026 | £350,000 |
| 17 May 2016 | £272,000 |
Flat 34, 14 Alexandra Court, St Peters Close, Hove BN3 7RF
| Today | See what it's worth now |
| 19 Mar 2026 | £154,000 |
| 14 Jun 2017 | £139,950 |
121, Hangleton Road, Hove BN3 7SF
| Today | See what it's worth now |
| 13 Mar 2026 | £610,000 |
| 28 Feb 2020 | £372,000 |
No other historical records.
13, Wilfrid Road, Hove BN3 7FJ
| Today | See what it's worth now |
| 6 Mar 2026 | £450,000 |
| 25 Nov 2013 | £225,000 |
No other historical records.
158, Holmes Avenue, Hove BN3 7LF
| Today | See what it's worth now |
| 25 Feb 2026 | £985,000 |
| 17 Sep 2009 | £335,000 |
No other historical records.
1, Bramber Avenue, Hove BN3 8GW

| Today | See what it's worth now |
| 24 Feb 2026 | £575,000 |
| 13 Sep 2013 | £213,000 |
No other historical records.
11, Orchard Road, Hove BN3 7BG
| Today | See what it's worth now |
| 23 Feb 2026 | £835,000 |
| 10 Aug 2012 | £499,950 |
27, Old School Place, Hove BN3 7FY
| Today | See what it's worth now |
| 20 Feb 2026 | £425,000 |
| 18 Jan 2006 | £280,000 |
No other historical records.
79, Northease Drive, Hove BN3 8PP
| Today | See what it's worth now |
| 20 Feb 2026 | £665,000 |
| 9 Oct 2020 | £365,000 |
No other historical records.
26, Applesham Avenue, Hove BN3 8JF

| Today | See what it's worth now |
| 17 Feb 2026 | £606,000 |
| 3 Feb 2020 | £400,000 |
No other historical records.
38, Sherbourne Road, Hove BN3 8BB
| Today | See what it's worth now |
| 17 Feb 2026 | £260,000 |
No other historical records.
7, Park Close, Hove BN3 8PD
| Today | See what it's worth now |
| 13 Feb 2026 | £405,000 |
No other historical records.
2, Maytree Close, Old Shoreham Road, Hove BN3 7DG
| Today | See what it's worth now |
| 13 Feb 2026 | £425,000 |
| 17 Jul 2018 | £330,000 |
73, Northease Drive, Hove BN3 8PP
| Today | See what it's worth now |
| 13 Feb 2026 | £500,000 |
No other historical records.
3, Poynings Drive, Hove BN3 8GF
| Today | See what it's worth now |
| 13 Feb 2026 | £237,000 |
| 27 Jan 2020 | £219,000 |
14, Godwin Road, Hove BN3 7FR
| Today | See what it's worth now |
| 13 Feb 2026 | £372,500 |
| 30 Jun 2023 | £356,500 |
45, Godwin Road, Hove BN3 7FQ
| Today | See what it's worth now |
| 11 Feb 2026 | £410,000 |
| 5 Aug 2021 | £337,000 |
No other historical records.
Source Acknowledgement: © Crown copyright. England and Wales house price data is publicly available information produced by the HM Land Registry.This material was last updated on 9 July 2026. It covers the period from 1 January 1995 to 30 April 2026 and contains property transactions which have been registered during that period. Contains HM Land Registry data © Crown copyright and database right 2026. This data is licensed under the Open Government Licence v3.0.
Disclaimer: Rightmove.co.uk provides this HM Land Registry data "as is". The burden for fitness of the data relies completely with the user and is provided for informational purposes only. No warranty, express or implied, is given relating to the accuracy of content of the HM Land Registry data and Rightmove does not accept any liability for error or omission. If you have found an error with the data or need further information please contact HM Land Registry.
Permitted Use: Viewers of this Information are granted permission to access this Crown copyright material and to download it onto electronic, magnetic, optical or similar storage media provided that such activities are for private research, study or in-house use only. Any other use of the material requires the formal written permission of Land Registry which can be requested from us, and is subject to an additional licence and associated charge.
Rightmove takes no liability for your use of, or reliance on, Rightmove's Instant Valuation due to the limitations of our tracking tool listed here. Use of this tool is taken entirely at your own risk. All rights reserved.