
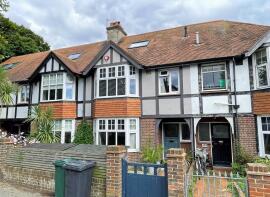
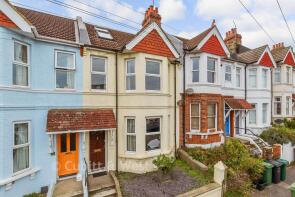
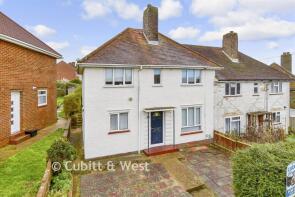
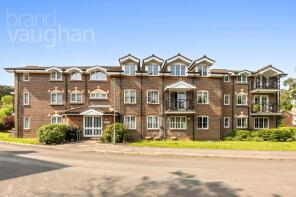
House Prices in Hollingbury
House prices in Hollingbury have an overall average of £552,861 over the last year.
The majority of properties sold in Hollingbury during the last year were terraced properties, selling for an average price of £618,412. Semi-detached properties sold for an average of £567,485, with flats fetching £315,160.
Overall, the historical sold prices in Hollingbury over the last year were 5% up on the previous year and similar to the 2022 peak of £554,704.
Properties Sold
26, Rotherfield Crescent, Brighton BN1 8FQ
| Today | See what it's worth now |
| 17 Apr 2026 | £410,000 |
| 23 Mar 2012 | £250,000 |
No other historical records.
39, Highview Way, Brighton BN1 8WS
| Today | See what it's worth now |
| 16 Apr 2026 | £460,000 |
| 7 Nov 1996 | £86,000 |
No other historical records.
12, Westfield Crescent, Brighton BN1 8JB
| Today | See what it's worth now |
| 9 Apr 2026 | £425,000 |
| 20 Jan 2023 | £450,000 |
156, Carden Avenue, Brighton BN1 8NH
| Today | See what it's worth now |
| 7 Apr 2026 | £535,000 |
| 8 Jul 2005 | £245,000 |
No other historical records.
11, Baranscraig Avenue, Brighton BN1 8RF
| Today | See what it's worth now |
| 2 Apr 2026 | £590,000 |
| 10 Apr 2007 | £250,000 |
48, Balfour Road, Brighton BN1 6NB

| Today | See what it's worth now |
| 1 Apr 2026 | £770,000 |
| 21 Aug 2008 | £329,000 |
181, Hollingdean Terrace, Brighton BN1 7HF
| Today | See what it's worth now |
| 1 Apr 2026 | £620,000 |
| 29 Mar 2021 | £370,000 |
No other historical records.
224, Carden Avenue, Brighton BN1 8LG
| Today | See what it's worth now |
| 31 Mar 2026 | £365,000 |
| 2 Apr 2007 | £224,950 |
No other historical records.
49, Florence Road, Brighton BN1 6DL
| Today | See what it's worth now |
| 27 Mar 2026 | £1,842,659 |
| 13 Jun 2025 | £1,055,000 |
41, The Deeside, Brighton BN1 8SA
| Today | See what it's worth now |
| 27 Mar 2026 | £465,000 |
| 20 Oct 2023 | £426,000 |
10, Lucerne Road, Brighton BN1 6GH
| Today | See what it's worth now |
| 27 Mar 2026 | £780,000 |
| 4 Aug 2017 | £628,500 |
No other historical records.
29, Whittingehame Gardens, Brighton BN1 6PU

| Today | See what it's worth now |
| 17 Mar 2026 | £660,000 |
| 12 Mar 2021 | £644,000 |
No other historical records.
35, Cuckmere Way, Brighton BN1 8GA
| Today | See what it's worth now |
| 17 Mar 2026 | £675,000 |
| 13 Apr 2017 | £395,000 |
268a, Ditchling Road, Brighton BN1 6JF

| Today | See what it's worth now |
| 16 Mar 2026 | £316,000 |
| 27 Nov 2020 | £323,500 |
32, Southdown Avenue, Brighton BN1 6EG
| Today | See what it's worth now |
| 16 Mar 2026 | £660,000 |
| 11 Sep 2009 | £359,000 |
4, Brentwood Close, Brighton BN1 7EW

| Today | See what it's worth now |
| 16 Mar 2026 | £428,500 |
No other historical records.
Flat 4, 196, Ditchling Road, Brighton BN1 6JE
| Today | See what it's worth now |
| 16 Mar 2026 | £306,000 |
| 1 Jun 2015 | £267,500 |
No other historical records.
410, Ditchling Road, Brighton BN1 6JL
| Today | See what it's worth now |
| 16 Mar 2026 | £700,000 |
| 29 Jul 2011 | £337,300 |
No other historical records.
63, Hollingbury Road, Brighton BN1 7JB
| Today | See what it's worth now |
| 13 Mar 2026 | £500,000 |
| 9 Jul 1999 | £84,950 |
No other historical records.
62, Stephens Road, Brighton BN1 7ER
| Today | See what it's worth now |
| 11 Mar 2026 | £370,000 |
| 17 Nov 2015 | £275,000 |
Flat 8, The Old Technical College, Preston Road, Brighton BN1 4QG

| Today | See what it's worth now |
| 6 Mar 2026 | £385,000 |
| 24 Jun 2021 | £390,000 |
No other historical records.
Flat 18 Sceptre, Tower Gate, London Road, Preston, Brighton BN1 6WT
| Today | See what it's worth now |
| 6 Mar 2026 | £282,000 |
| 1 Jul 2013 | £195,500 |
5, The Mews, Towergate, Brighton BN1 6TU
| Today | See what it's worth now |
| 6 Mar 2026 | £640,000 |
| 28 Sep 2018 | £480,000 |


Source Acknowledgement: © Crown copyright. England and Wales house price data is publicly available information produced by the HM Land Registry.This material was last updated on 9 July 2026. It covers the period from 1 January 1995 to 30 April 2026 and contains property transactions which have been registered during that period. Contains HM Land Registry data © Crown copyright and database right 2026. This data is licensed under the Open Government Licence v3.0.
Disclaimer: Rightmove.co.uk provides this HM Land Registry data "as is". The burden for fitness of the data relies completely with the user and is provided for informational purposes only. No warranty, express or implied, is given relating to the accuracy of content of the HM Land Registry data and Rightmove does not accept any liability for error or omission. If you have found an error with the data or need further information please contact HM Land Registry.
Permitted Use: Viewers of this Information are granted permission to access this Crown copyright material and to download it onto electronic, magnetic, optical or similar storage media provided that such activities are for private research, study or in-house use only. Any other use of the material requires the formal written permission of Land Registry which can be requested from us, and is subject to an additional licence and associated charge.
Rightmove takes no liability for your use of, or reliance on, Rightmove's Instant Valuation due to the limitations of our tracking tool listed here. Use of this tool is taken entirely at your own risk. All rights reserved.