
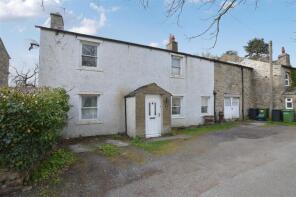
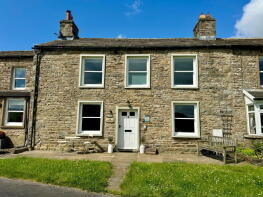
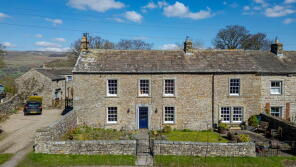
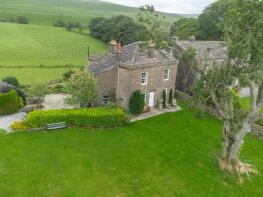
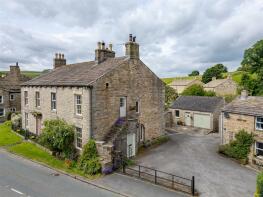
House Prices in Hardraw
House prices in Hardraw have an overall average of £328,120 over the last year.
The majority of properties sold in Hardraw during the last year were terraced properties, selling for an average price of £290,841. Detached properties sold for an average of £402,650, with semi-detached properties fetching £210,000.
Overall, the historical sold prices in Hardraw over the last year were similar to the previous year and 8% down on the 2022 peak of £358,088.
Properties Sold
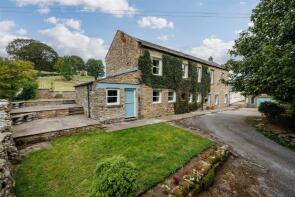
Drumlins, Westholme Bank, Leyburn DL8 3SP
| Today | See what it's worth now |
| 24 Apr 2026 | £600,000 |
| 19 Dec 2003 | £330,000 |
No other historical records.
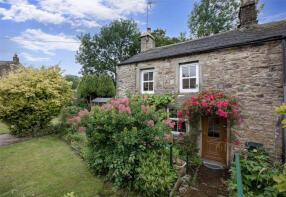
Beehouse Cottage, Penn Lane, Hawes DL8 3QU
| Today | See what it's worth now |
| 17 Apr 2026 | £245,500 |
No other historical records.
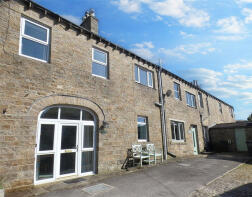
2, Winville Mews, Main Street, Askrigg DL8 3HG
| Today | See what it's worth now |
| 7 Apr 2026 | £180,000 |
| 12 Aug 2002 | £92,500 |
No other historical records.
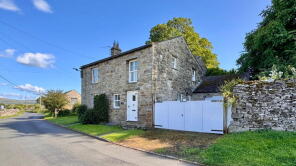
Millbeck, Main Street, Thornton Rust DL8 3AW
| Today | See what it's worth now |
| 30 Mar 2026 | £270,000 |
No other historical records.
Hallgarth Cottage, Thoralby DL8 3SZ
| Today | See what it's worth now |
| 19 Mar 2026 | £467,500 |
No other historical records.
Holmesgarth, Main Street, Leyburn DL8 3AH
| Today | See what it's worth now |
| 6 Mar 2026 | £250,000 |
| 19 May 2005 | £242,000 |
No other historical records.
2, Riverdale, Back Syke, Leyburn DL8 3GA
| Today | See what it's worth now |
| 3 Mar 2026 | £276,000 |
| 4 Jan 2019 | £220,000 |
No other historical records.
Manor House Farm, Main Street, Leyburn DL8 3AN
| Today | See what it's worth now |
| 27 Feb 2026 | £554,000 |
| 16 Mar 2020 | £415,000 |
Stonelea, Leyburn Road, Leyburn DL8 3HJ
| Today | See what it's worth now |
| 27 Jan 2026 | £490,000 |
| 13 Aug 2013 | £275,000 |
No other historical records.
Rigg House West, Hawes To Garsdale Head, Hawes DL8 3LR
| Today | See what it's worth now |
| 27 Jan 2026 | £550,000 |
| 4 Apr 2003 | £285,000 |
Middlegate House, New Lane, Hawes DL8 3PB
| Today | See what it's worth now |
| 20 Jan 2026 | £509,000 |
| 23 Jul 2019 | £310,000 |
1, Winville Mews, Main Street, Leyburn DL8 3HG
| Today | See what it's worth now |
| 18 Dec 2025 | £175,000 |
| 19 Jul 2002 | £82,000 |
No other historical records.
Marlbeck House, Main Street, Leyburn DL8 3AB
| Today | See what it's worth now |
| 11 Dec 2025 | £435,000 |
| 7 Jun 2024 | £440,000 |
Flat 6, Mill Lane Flats, Mill Lane, Leyburn DL8 3HW
| Today | See what it's worth now |
| 10 Dec 2025 | £111,000 |
| 21 Dec 2005 | £95,000 |
No other historical records.
3, St Josephs Mews, Church Bank, Leyburn DL8 3SR
| Today | See what it's worth now |
| 5 Dec 2025 | £260,000 |
| 1 Aug 2014 | £230,000 |
Church View, Main Street, Askrigg DL8 3HT
| Today | See what it's worth now |
| 4 Dec 2025 | £190,000 |
No other historical records.
Havenleigh, Burtersett Road, Hawes DL8 3NP
| Today | See what it's worth now |
| 31 Oct 2025 | £315,000 |
| 25 Oct 2002 | £183,000 |
Longdale Cottage, Raydale House Road, Leyburn DL8 3DQ
| Today | See what it's worth now |
| 24 Oct 2025 | £340,000 |
| 8 Jul 2020 | £260,000 |
1, South View, Shaws Lane, Hawes DL8 3PD
| Today | See what it's worth now |
| 24 Oct 2025 | £275,000 |
| 14 Aug 2006 | £180,000 |
Cobblestone Cottage, Garris, Hawes DL8 3RX
| Today | See what it's worth now |
| 1 Sep 2025 | £262,500 |
| 18 Sep 2017 | £218,150 |
1, Old Mill, Silver Street, Askrigg DL8 3HS
| Today | See what it's worth now |
| 24 Jul 2025 | £271,250 |
| 14 Mar 2008 | £235,000 |
No other historical records.
Calverts Nook, The Gaits, Hawes DL8 3RU
| Today | See what it's worth now |
| 22 Jul 2025 | £210,000 |
| 6 Apr 2018 | £198,000 |
Fossings, Bowbridge, Askrigg, Breconbar DL8 3DX
| Today | See what it's worth now |
| 4 Jul 2025 | £310,000 |
| 2 Aug 2013 | £290,000 |
No other historical records.
Source Acknowledgement: © Crown copyright. England and Wales house price data is publicly available information produced by the HM Land Registry.This material was last updated on 9 July 2026. It covers the period from 1 January 1995 to 30 April 2026 and contains property transactions which have been registered during that period. Contains HM Land Registry data © Crown copyright and database right 2026. This data is licensed under the Open Government Licence v3.0.
Disclaimer: Rightmove.co.uk provides this HM Land Registry data "as is". The burden for fitness of the data relies completely with the user and is provided for informational purposes only. No warranty, express or implied, is given relating to the accuracy of content of the HM Land Registry data and Rightmove does not accept any liability for error or omission. If you have found an error with the data or need further information please contact HM Land Registry.
Permitted Use: Viewers of this Information are granted permission to access this Crown copyright material and to download it onto electronic, magnetic, optical or similar storage media provided that such activities are for private research, study or in-house use only. Any other use of the material requires the formal written permission of Land Registry which can be requested from us, and is subject to an additional licence and associated charge.
Rightmove takes no liability for your use of, or reliance on, Rightmove's Instant Valuation due to the limitations of our tracking tool listed here. Use of this tool is taken entirely at your own risk. All rights reserved.