
House Prices in Hawkwell
House prices in Hawkwell have an overall average of £562,439 over the last year.
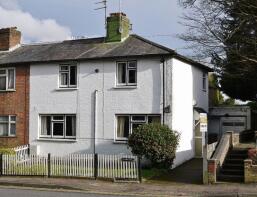
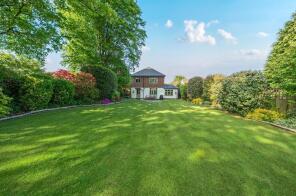
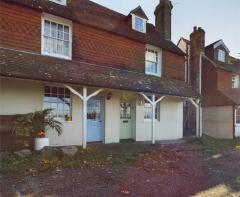
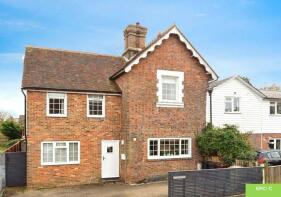
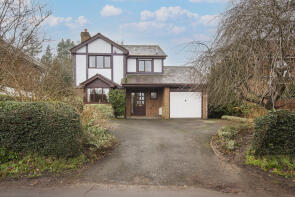
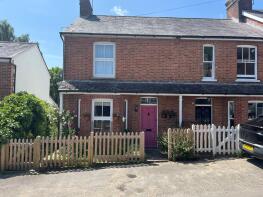
The majority of properties sold in Hawkwell during the last year were detached properties, selling for an average price of £809,847. Terraced properties sold for an average of £364,636, with semi-detached properties fetching £601,562.
Overall, the historical sold prices in Hawkwell over the last year were 2% down on the previous year and similar to the 2022 peak of £566,703.
Properties Sold
25, St Peters Street, Tunbridge Wells TN2 4UX
| Today | See what it's worth now |
| 13 Mar 2026 | £390,640 |
| 1 Mar 2022 | £383,750 |
6, Beech Hurst, Pembury, Tunbridge Wells TN2 4DU
| Today | See what it's worth now |
| 6 Mar 2026 | £210,000 |
| 17 Mar 2006 | £122,500 |
6, Hastings Road, Pembury, Tunbridge Wells TN2 4PD

| Today | See what it's worth now |
| 5 Mar 2026 | £770,000 |
No other historical records.
28a Dell Cottage, Hastings Road, Pembury, Tunbridge Wells TN2 4PD

| Today | See what it's worth now |
| 2 Mar 2026 | £590,000 |
| 30 Jul 2019 | £380,000 |
4, Cornford Close, Pembury, Tunbridge Wells TN2 4QP

| Today | See what it's worth now |
| 25 Feb 2026 | £612,500 |
No other historical records.
28, Maidstone Road, Pembury, Tunbridge Wells TN2 4DE
| Today | See what it's worth now |
| 18 Feb 2026 | £625,000 |
| 1 May 1997 | £84,500 |
No other historical records.
84, Cromwell Road, Tunbridge Wells TN2 4UD
| Today | See what it's worth now |
| 30 Jan 2026 | £450,000 |
| 31 Jan 2019 | £355,000 |
Flat 8, Tranquil View, High Street, Pembury, Tunbridge Wells TN2 4PH

| Today | See what it's worth now |
| 30 Jan 2026 | £360,000 |
| 8 Sep 2022 | £345,000 |
No other historical records.
182, Henwood Green Road, Pembury, Tunbridge Wells TN2 4LR
| Today | See what it's worth now |
| 30 Jan 2026 | £180,000 |
No other historical records.
37, Princes Street, Tunbridge Wells TN2 4SL
| Today | See what it's worth now |
| 29 Jan 2026 | £818,000 |
| 31 Mar 2021 | £703,500 |
28, Park Street, Tunbridge Wells TN2 4SP

| Today | See what it's worth now |
| 23 Jan 2026 | £354,250 |
| 30 May 2023 | £380,000 |
26, Henwoods Mount, Pembury, Tunbridge Wells TN2 4BH
| Today | See what it's worth now |
| 15 Jan 2026 | £530,000 |
| 23 Sep 2016 | £348,000 |
Flat 1, 8, Thornfield Gardens, Tunbridge Wells TN2 4RZ

| Today | See what it's worth now |
| 13 Jan 2026 | £250,000 |
| 18 Jun 2004 | £163,000 |
Stillness, Cornford Lane, Royal Tunbridge Wells TN2 4QX
| Today | See what it's worth now |
| 19 Dec 2025 | £1,120,000 |
No other historical records.
Flat 1, Cambridge House, Cambridge Gardens, Royal Tunbridge Wells TN2 4SB
| Today | See what it's worth now |
| 17 Dec 2025 | £440,000 |
No other historical records.
4 White Cottage, Lower Green Road, Pembury, Tunbridge Wells TN2 4HE
| Today | See what it's worth now |
| 16 Dec 2025 | £420,000 |
| 14 Jul 2014 | £275,000 |
No other historical records.
14, Romford Road, Pembury, Tunbridge Wells TN2 4JA
| Today | See what it's worth now |
| 16 Dec 2025 | £935,000 |
| 17 Dec 2008 | £350,000 |
6, Hawkwell Cottage, Maidstone Road, Pembury, Tunbridge Wells TN2 4AE
| Today | See what it's worth now |
| 15 Dec 2025 | £190,000 |
| 10 Sep 1999 | £120,000 |
No other historical records.
13, Romford Road, Pembury, Tunbridge Wells TN2 4JB
| Today | See what it's worth now |
| 5 Dec 2025 | £595,000 |
| 8 Aug 2014 | £390,000 |
4, Henwoods Crescent, Pembury, Tunbridge Wells TN2 4LJ

| Today | See what it's worth now |
| 28 Nov 2025 | £565,000 |
| 9 May 2008 | £303,000 |
No other historical records.
12, Romford Road, Pembury, Tunbridge Wells TN2 4JA
| Today | See what it's worth now |
| 28 Nov 2025 | £715,000 |
| 22 Jul 1996 | £147,985 |
The Granary, Downingbury Farm, Maidstone Road, Pembury, Tunbridge Wells TN2 4AD
| Today | See what it's worth now |
| 27 Nov 2025 | £870,000 |
| 24 Sep 2009 | £475,000 |
No other historical records.
49, Romford Road, Pembury, Tunbridge Wells TN2 4JB

| Today | See what it's worth now |
| 27 Nov 2025 | £645,000 |
| 27 Jun 2008 | £415,000 |
No other historical records.
7, Stafford Road, Tunbridge Wells TN2 4QZ
| Today | See what it's worth now |
| 26 Nov 2025 | £455,000 |
| 1 Dec 2003 | £245,000 |
19, Sweeps Hill Close, Pembury, Tunbridge Wells TN2 4LT

| Today | See what it's worth now |
| 25 Nov 2025 | £390,000 |
| 9 Jun 2005 | £229,995 |
Source Acknowledgement: © Crown copyright. England and Wales house price data is publicly available information produced by the HM Land Registry.This material was last updated on 15 May 2026. It covers the period from 1 January 1995 to 31 March 2026 and contains property transactions which have been registered during that period. Contains HM Land Registry data © Crown copyright and database right 2026. This data is licensed under the Open Government Licence v3.0.
Disclaimer: Rightmove.co.uk provides this HM Land Registry data "as is". The burden for fitness of the data relies completely with the user and is provided for informational purposes only. No warranty, express or implied, is given relating to the accuracy of content of the HM Land Registry data and Rightmove does not accept any liability for error or omission. If you have found an error with the data or need further information please contact HM Land Registry.
Permitted Use: Viewers of this Information are granted permission to access this Crown copyright material and to download it onto electronic, magnetic, optical or similar storage media provided that such activities are for private research, study or in-house use only. Any other use of the material requires the formal written permission of Land Registry which can be requested from us, and is subject to an additional licence and associated charge.
Map data ©OpenStreetMap contributors.
Rightmove takes no liability for your use of, or reliance on, Rightmove's Instant Valuation due to the limitations of our tracking tool listed here. Use of this tool is taken entirely at your own risk. All rights reserved.