
House Prices in Hen Golwyn
House prices in Hen Golwyn have an overall average of £216,027 over the last year.
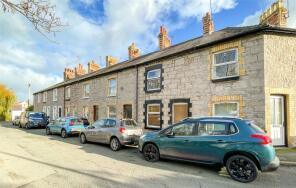
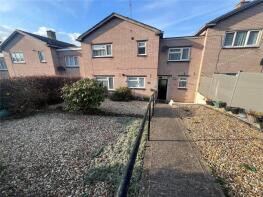
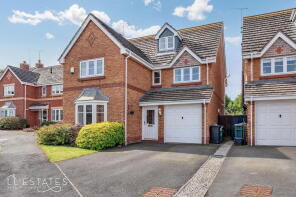
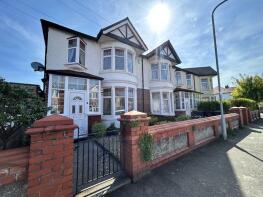
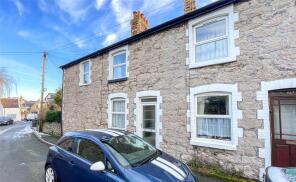
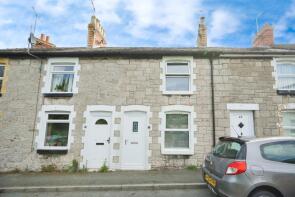
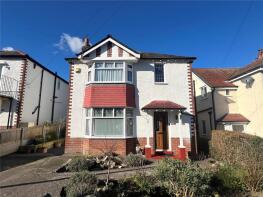
The majority of properties sold in Hen Golwyn during the last year were terraced properties, selling for an average price of £153,237. Semi-detached properties sold for an average of £193,122, with detached properties fetching £358,133.
Overall, the historical sold prices in Hen Golwyn over the last year were 3% up on the previous year and 12% up on the 2021 peak of £192,541.
Properties Sold
16 Grande Vue, Cambria Road, Old Colwyn, Colwyn Bay LL29 9AG
| Today | See what it's worth now |
| 24 Mar 2026 | £265,000 |
| 18 Jan 2008 | £119,500 |
41 Gayton, Coed Coch Road, Old Colwyn, Colwyn Bay LL29 9UP
| Today | See what it's worth now |
| 10 Mar 2026 | £162,000 |
| 9 Nov 2009 | £101,500 |
No other historical records.
31 Rhobec, Wynn Avenue North, Old Colwyn, Colwyn Bay LL29 9RH
| Today | See what it's worth now |
| 4 Mar 2026 | £460,000 |
| 19 Dec 2003 | £245,000 |
No other historical records.
14, Llawr Pentre, Old Colwyn, Colwyn Bay LL29 9RP
| Today | See what it's worth now |
| 4 Mar 2026 | £185,000 |
| 12 Sep 2024 | £97,420 |
No other historical records.
3 Llys Gwilym, Church Walks, Old Colwyn, Colwyn Bay LL29 9RU
| Today | See what it's worth now |
| 6 Feb 2026 | £170,000 |
| 14 Nov 2018 | £114,500 |
12, Albert Road, Old Colwyn, Colwyn Bay LL29 9TE
| Today | See what it's worth now |
| 16 Jan 2026 | £200,000 |
No other historical records.
Bushcroft, Station Road, Old Colwyn, Colwyn Bay LL29 9RG
| Today | See what it's worth now |
| 8 Jan 2026 | £240,000 |
No other historical records.
6, Bryn Teg Avenue, Old Colwyn, Colwyn Bay LL29 9TP
| Today | See what it's worth now |
| 19 Dec 2025 | £165,000 |
| 29 Nov 2019 | £119,000 |
15, Pen Y Bryn, Old Colwyn, Colwyn Bay LL29 9UU
| Today | See what it's worth now |
| 17 Dec 2025 | £108,000 |
| 14 Nov 2003 | £68,000 |
209, Peulwys Lane, Old Colwyn, Colwyn Bay LL29 9DD
| Today | See what it's worth now |
| 15 Dec 2025 | £105,000 |
No other historical records.
46, St David's Road, Old Colwyn, Colwyn Bay LL29 9BL
| Today | See what it's worth now |
| 12 Dec 2025 | £160,000 |
No other historical records.
8, Tanllwyfan, Old Colwyn, Colwyn Bay LL29 9LQ
| Today | See what it's worth now |
| 12 Dec 2025 | £380,000 |
| 4 May 2007 | £249,950 |
18 Wemyss, Kensington Avenue, Old Colwyn, Colwyn Bay LL29 9SS
| Today | See what it's worth now |
| 8 Dec 2025 | £234,000 |
| 27 Mar 2000 | £59,950 |
68, Llanelian Road, Old Colwyn, Colwyn Bay LL29 9UA

| Today | See what it's worth now |
| 5 Dec 2025 | £270,000 |
| 10 Nov 2023 | £210,000 |
19, Wynn Avenue, Old Colwyn, Colwyn Bay LL29 9RF
| Today | See what it's worth now |
| 28 Nov 2025 | £320,000 |
| 17 Aug 2018 | £320,000 |
6, David Edwards Close, Old Colwyn, Colwyn Bay LL29 9UE
| Today | See what it's worth now |
| 25 Nov 2025 | £173,000 |
| 24 May 2007 | £133,950 |
3 Anyholme, Sandhills Road, Old Colwyn, Colwyn Bay LL29 9UD
| Today | See what it's worth now |
| 25 Nov 2025 | £225,500 |
| 4 May 2012 | £132,500 |
No other historical records.
19, Rose Hill, Old Colwyn, Colwyn Bay LL29 9RS
| Today | See what it's worth now |
| 14 Nov 2025 | £65,000 |
| 16 Jan 1998 | £24,500 |
No other historical records.
38 Pennant, Pen Y Bryn, Old Colwyn, Colwyn Bay LL29 9UU
| Today | See what it's worth now |
| 10 Nov 2025 | £130,000 |
| 15 Sep 2023 | £122,000 |
21, Pen Y Bryn, Old Colwyn, Colwyn Bay LL29 9UU
| Today | See what it's worth now |
| 31 Oct 2025 | £138,000 |
| 15 Feb 2019 | £98,500 |
15 Bethel Cottage, Miners Lane, Old Colwyn, Colwyn Bay LL29 9AL
| Today | See what it's worth now |
| 29 Oct 2025 | £189,950 |
| 14 Aug 2009 | £132,000 |
12, St Catherine's Drive, Old Colwyn, Colwyn Bay LL29 9TT
| Today | See what it's worth now |
| 24 Oct 2025 | £220,000 |
No other historical records.
Apartment 54, Penmaen Bod Elias, Abergele Road, Old Colwyn, Colwyn Bay LL29 8BL
| Today | See what it's worth now |
| 24 Oct 2025 | £97,500 |
| 22 Apr 2022 | £95,000 |
Source Acknowledgement: © Crown copyright. England and Wales house price data is publicly available information produced by the HM Land Registry.This material was last updated on 15 May 2026. It covers the period from 1 January 1995 to 31 March 2026 and contains property transactions which have been registered during that period. Contains HM Land Registry data © Crown copyright and database right 2026. This data is licensed under the Open Government Licence v3.0.
Disclaimer: Rightmove.co.uk provides this HM Land Registry data "as is". The burden for fitness of the data relies completely with the user and is provided for informational purposes only. No warranty, express or implied, is given relating to the accuracy of content of the HM Land Registry data and Rightmove does not accept any liability for error or omission. If you have found an error with the data or need further information please contact HM Land Registry.
Permitted Use: Viewers of this Information are granted permission to access this Crown copyright material and to download it onto electronic, magnetic, optical or similar storage media provided that such activities are for private research, study or in-house use only. Any other use of the material requires the formal written permission of Land Registry which can be requested from us, and is subject to an additional licence and associated charge.
Map data ©OpenStreetMap contributors.
Rightmove takes no liability for your use of, or reliance on, Rightmove's Instant Valuation due to the limitations of our tracking tool listed here. Use of this tool is taken entirely at your own risk. All rights reserved.